Yearn.Finance Price Prediction: YFI ready to explode to $28,000 as upward pressure builds up
- Yearn.Finance stalls under $24,000, but most technical and on-chain indexes point towards a breakout.
- YFI/USD must hold the ground $20,000 to ensure that bulls do not lose focus of the anticipated rally to $28,000.

Yearn.Finance's upward momentum has consistently developed since a bottom was called at $8,000. The decentralized (YFI) token is likely to lift off to $28,000 as long as the crucial hurdle is shattered at $24,000.
Yearn.Finance holds at the threshold as $28,000 beckons
YFI is still the most expensive cryptocurrency token in the market, despite Bitcoin rallying towards $18,000. The rebound from the bottom at $8,000 has been progressive so that barriers are frequently flipped into support levels.
At the time of writing, Yearn.Finance is trading at $23,510 while dealing with the selling pressure at $24,000. The crypto is trading above all the three simple moving averages; the 50 SMA, 100 SMA, and 200 SMA. In other words, the least resistance path is upwards, even ignoring the overbought condition as highlighted by the Relative Strength Index.
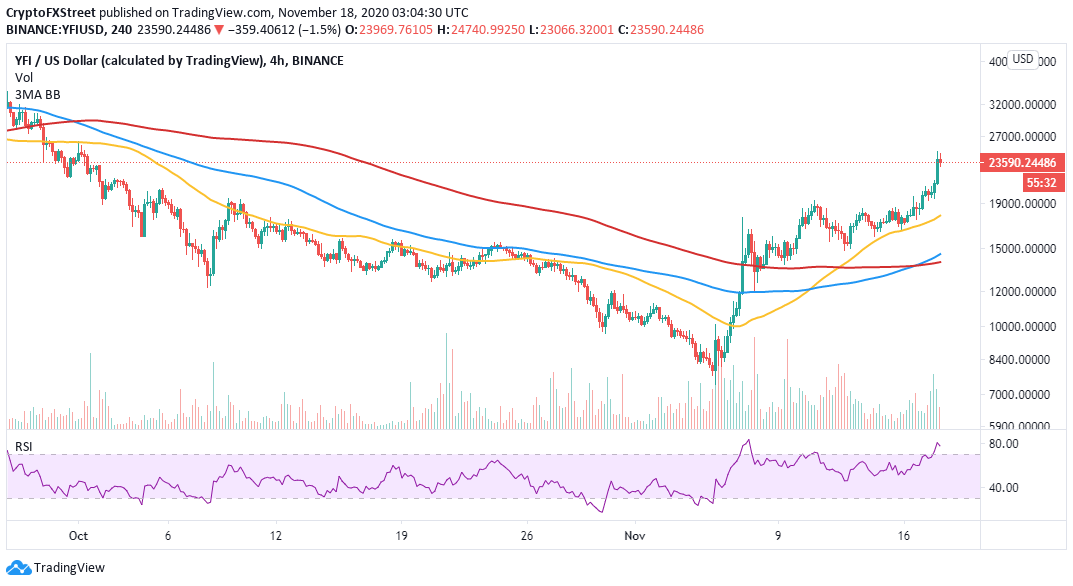
YFI/USD 4-hour chart
According to the 4-hour chart, the TD Sequential indicator's multiple sell signals have been invalidated in the last two weeks. Sell signals take the form of green nine candlesticks. When invalidated, the price tends to rally some more before another signal is flashed. For instance, a recent sell signal was ignored as YFI spiked further, hitting $24,944.
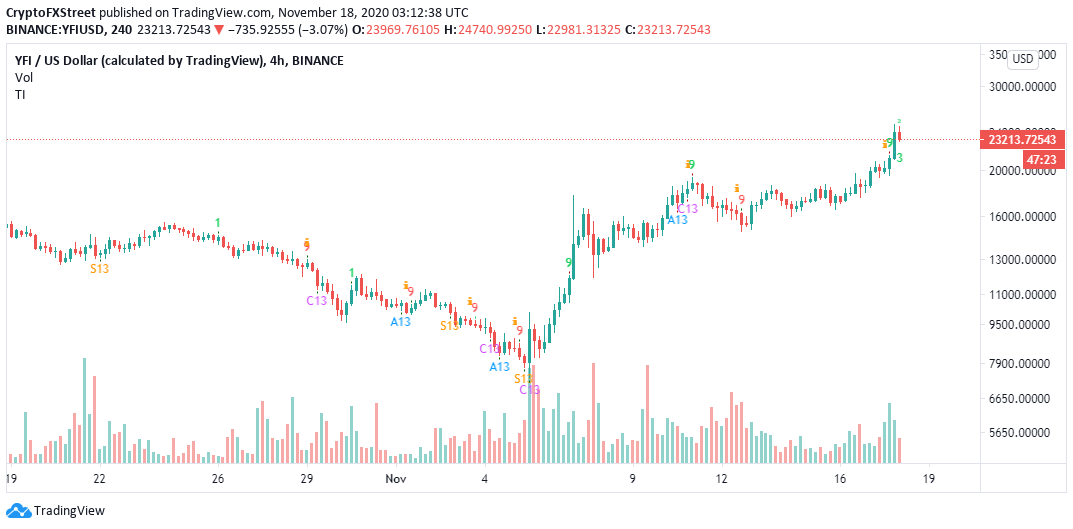
YFI/USD 4-hour chart
IntoTheBlock's "Daily New Addresses" metric printed a bullish pattern from November 14 when 338 new addresses joined the platform. At the time of writing, the newly created addresses on the network have more than doubled to 770. In other words, YFI adoption is on an impressive uptrend, which is also a bullish signal for the value of the token and validates the bullish outlook.
-637412677605267389.png)
YFI daily new addresses chart
The IOMAP model by IntoTheBlock reveals that YFI is ready to take off towards $28,000 if the medium-strong resistance between $24,575 and $25,255 is broken. Here, 321 addresses are holding nearly 331 YFI.
-637412677152112261.png)
Yearn.finance IOMAP chart
On the downside, it worth noting that bears have some room to play before YFI finds credible support. The model above highlights robust support between $19,682 and $20,405. Here, 824 addresses had previously bought approximately 1,500 YFI. Therefore, buyers must push the price above $24,000 to ensure that extended losses are averted.
Author

John Isige
FXStreet
John Isige is a seasoned cryptocurrency journalist and markets analyst committed to delivering high-quality, actionable insights tailored to traders, investors, and crypto enthusiasts. He enjoys deep dives into emerging Web3 tren


