- YFI price is contained inside an ascending parallel channel formed on the 4-hour chart.
- The digital asset seems to be aiming for $24,000 as bullish momentum picks up.
YFI is bounded inside an ascending parallel channel and has just defended the lower trendline bouncing off towards $19,000. The momentum is shifting back in favor of the bulls which are aiming for $24,000.
YFI needs to hold a critical support level to see $24,000
Despite the bounce on November 16 from the lower boundary of the ascending parallel channel, bulls still need to make sure to hold this level. The next price target could be $20,000 which is the middle of the pattern.
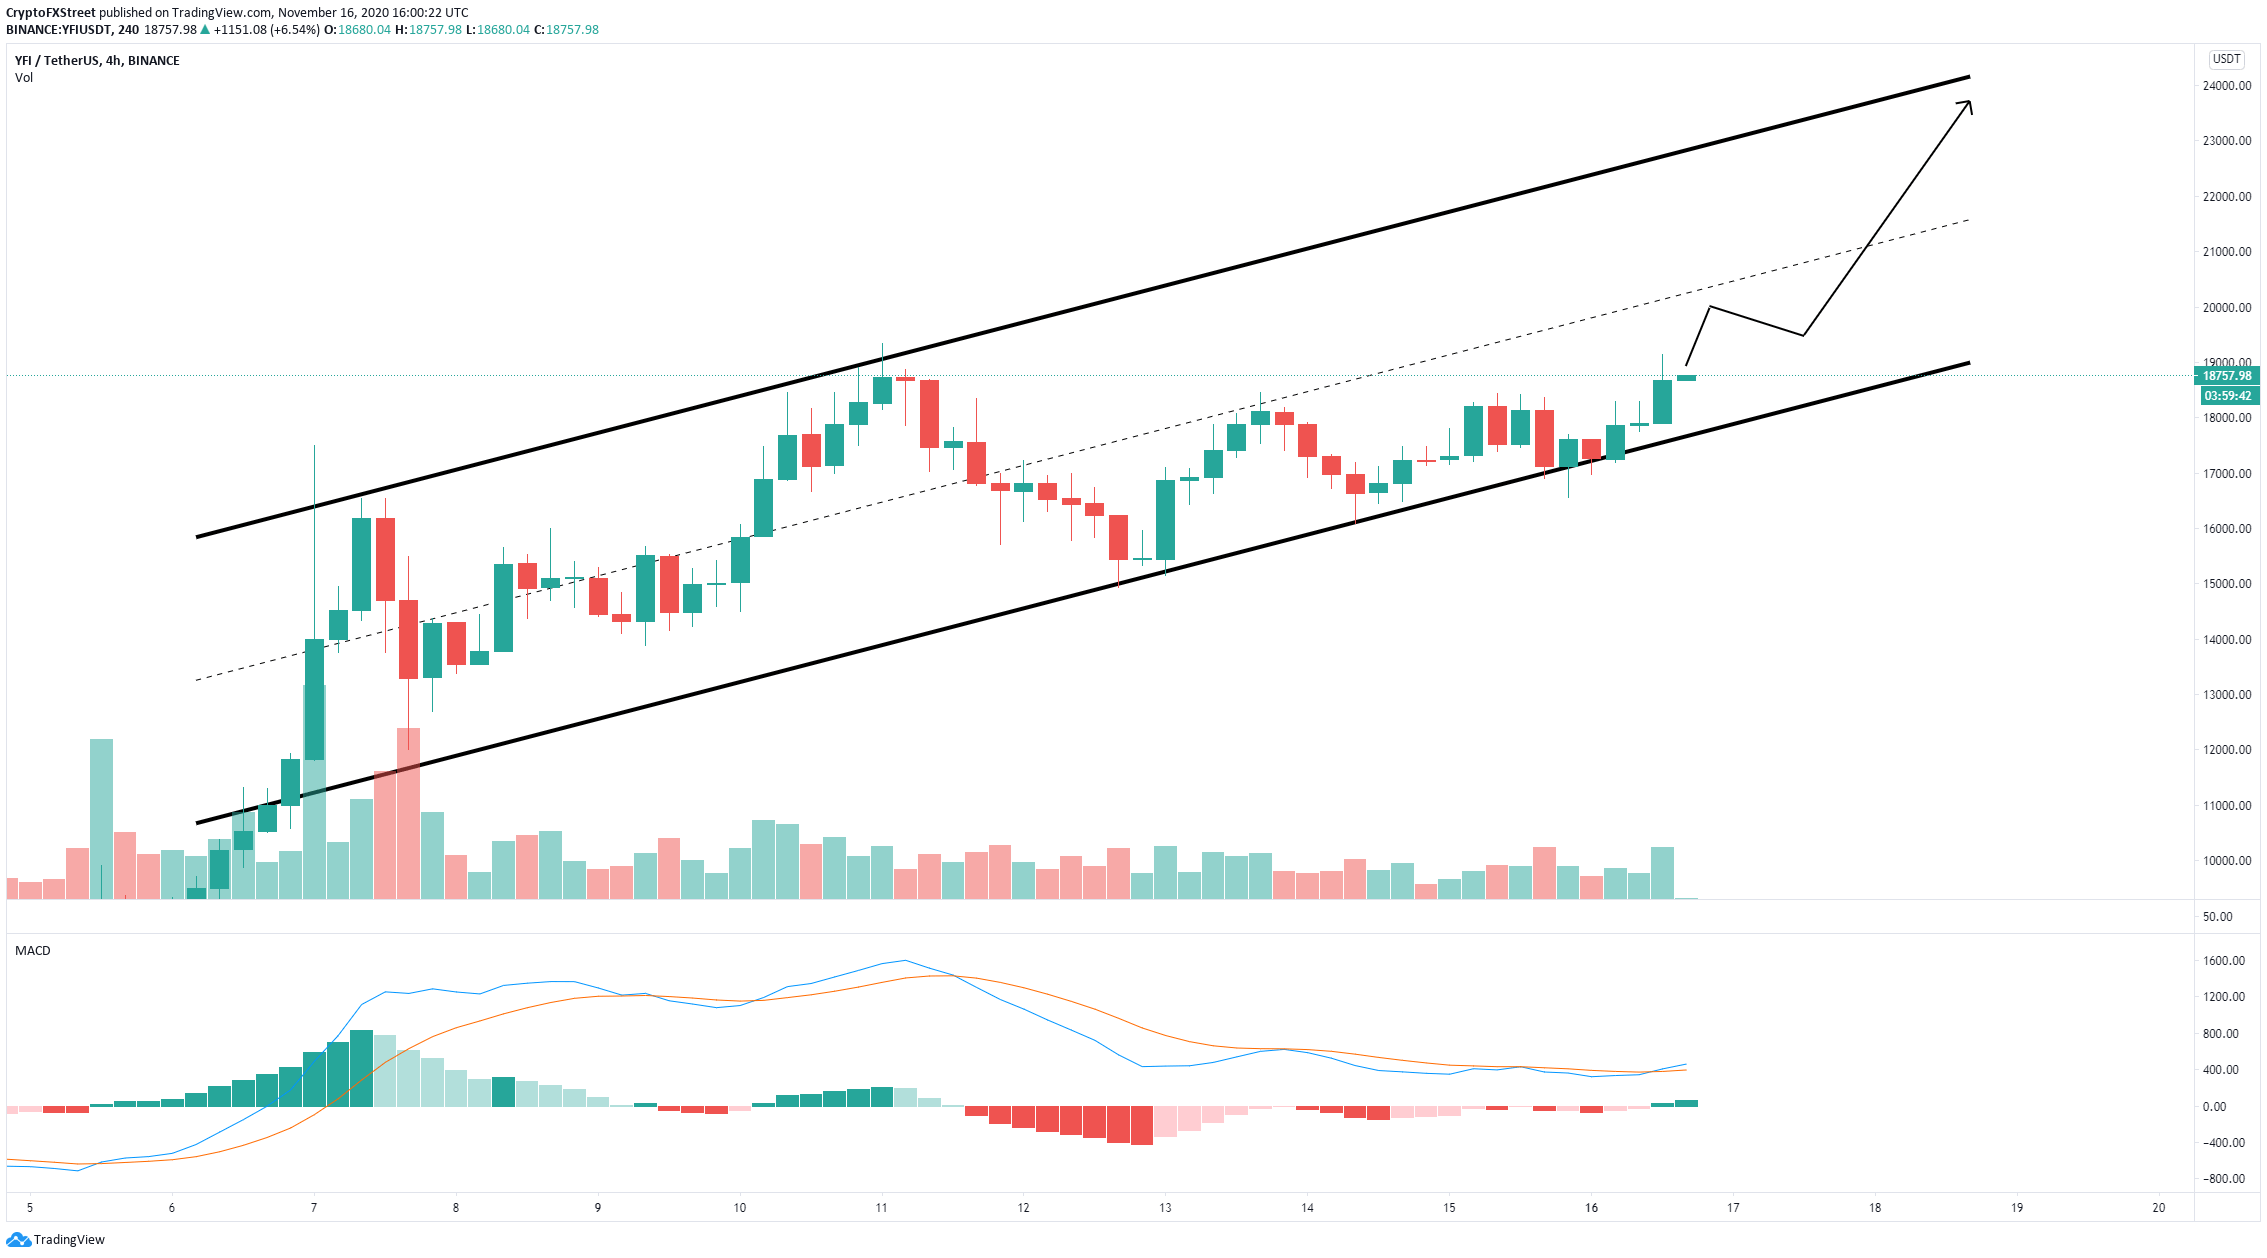
YFI/USD 4-hour chart
If YFI price experiences a small retrace after hitting $20,000, it would be considered healthy and a continuation of the bull move. The next price target after the pullback would be the top of the pattern at $24,000. Additionally, the MACD also turned bullish for the first time since November 10, indicating that the bounce has good strength behind it.
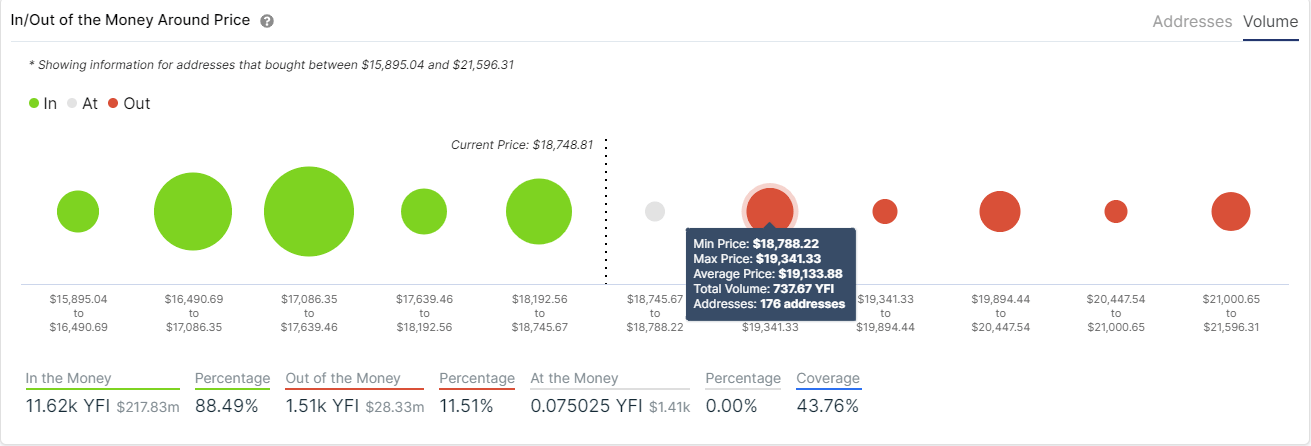
YFI IOMAP chart
The In/Out of the Money Around Price chart only shows a mildly strong resistance area between $18,788 and $19,341 but a lot of support on the way down capable of absorbing a lot of selling pressure in the short-term.
If YFI price can’t climb above the resistance level at $19,000 or gets strongly rejected from the middle trendline of the pattern at $20,000, bears could target the lower trendline at $17,800 again, and potentially $17,000 looking at the IOMAP chart.
Information on these pages contains forward-looking statements that involve risks and uncertainties. Markets and instruments profiled on this page are for informational purposes only and should not in any way come across as a recommendation to buy or sell in these assets. You should do your own thorough research before making any investment decisions. FXStreet does not in any way guarantee that this information is free from mistakes, errors, or material misstatements. It also does not guarantee that this information is of a timely nature. Investing in Open Markets involves a great deal of risk, including the loss of all or a portion of your investment, as well as emotional distress. All risks, losses and costs associated with investing, including total loss of principal, are your responsibility. The views and opinions expressed in this article are those of the authors and do not necessarily reflect the official policy or position of FXStreet nor its advertisers.
Latest Crypto News & Analysis
Editors’ Picks
Cardano Price Forecast: ADA targets 900% bull rally, but it must clear $0.33 first
Cardano had a significant rally towards $0.355 at the beginning of 2021. After a notable dip to $0.228, bulls bought it and managed to push Cardano price to $0.33 again before a small rejection.
Ethereum price aims to flush out doubters before the ultimate breakout to $2,000
Ethereum bulls bought the dip on January 11, pushing the digital asset from a low of $915 towards $1,256. The smart-contracts giant has been outperforming Bitcoin in the past 24 hours despite the negativity seen on social media.
XLM Price Prediction: Stellar consolidates ahead of a 30% move
XLM price trades at $0.291 at the time of writing after a healthy consolidation after hitting a 2021-top at $0.411. There is a high chance that XLM is about to see a massive breakout or breakdown within the next 24 hours.
Bitcoin Weekly Forecast: BTC price faces extreme volatility ahead of a new all-time high
Bitcoin had a wild run this week, dropping from a high of $41,350 to a low of 30,420 in less than 48 hours. The panic sell-off was stopped on its tracks at the 26-EMA on the daily chart as bulls quickly bought the dip and created a V-Shape recovery pushing BTC towards $40,100 again.
Bitcoin Weekly Forecast: BTC price faces extreme volatility ahead of a new all-time high
Bitcoin had a wild run this week, dropping from a high of $41,350 to a low of 30,420 in less than 48 hours.