Yearn.Finance Price Prediction: YFI may take a hit before a massive rally to $35,000
- Yearn.Finance price seems to be forming a head-and-shoulders pattern on the 4-hour chart.
- Several indicators suggest the digital asset might be poised for a pullback in the short-term.

YFI has managed to see a 47% bounce in the past four days after hitting a low of $18,228 on November 26. Bulls are looking to establish a higher high on the daily chart and break $29,890. However, some indicators suggest the digital asset might need to retrace first.
Yearn.Finance price is inside a head and shoulders pattern
On the 4-hour chart, YFI has created what seems to be a head-and-shoulders pattern with the neckline at $26,600. If this pattern is confirmed, Yearn.Finance price would need to dip towards $22,000 first before a breakout.
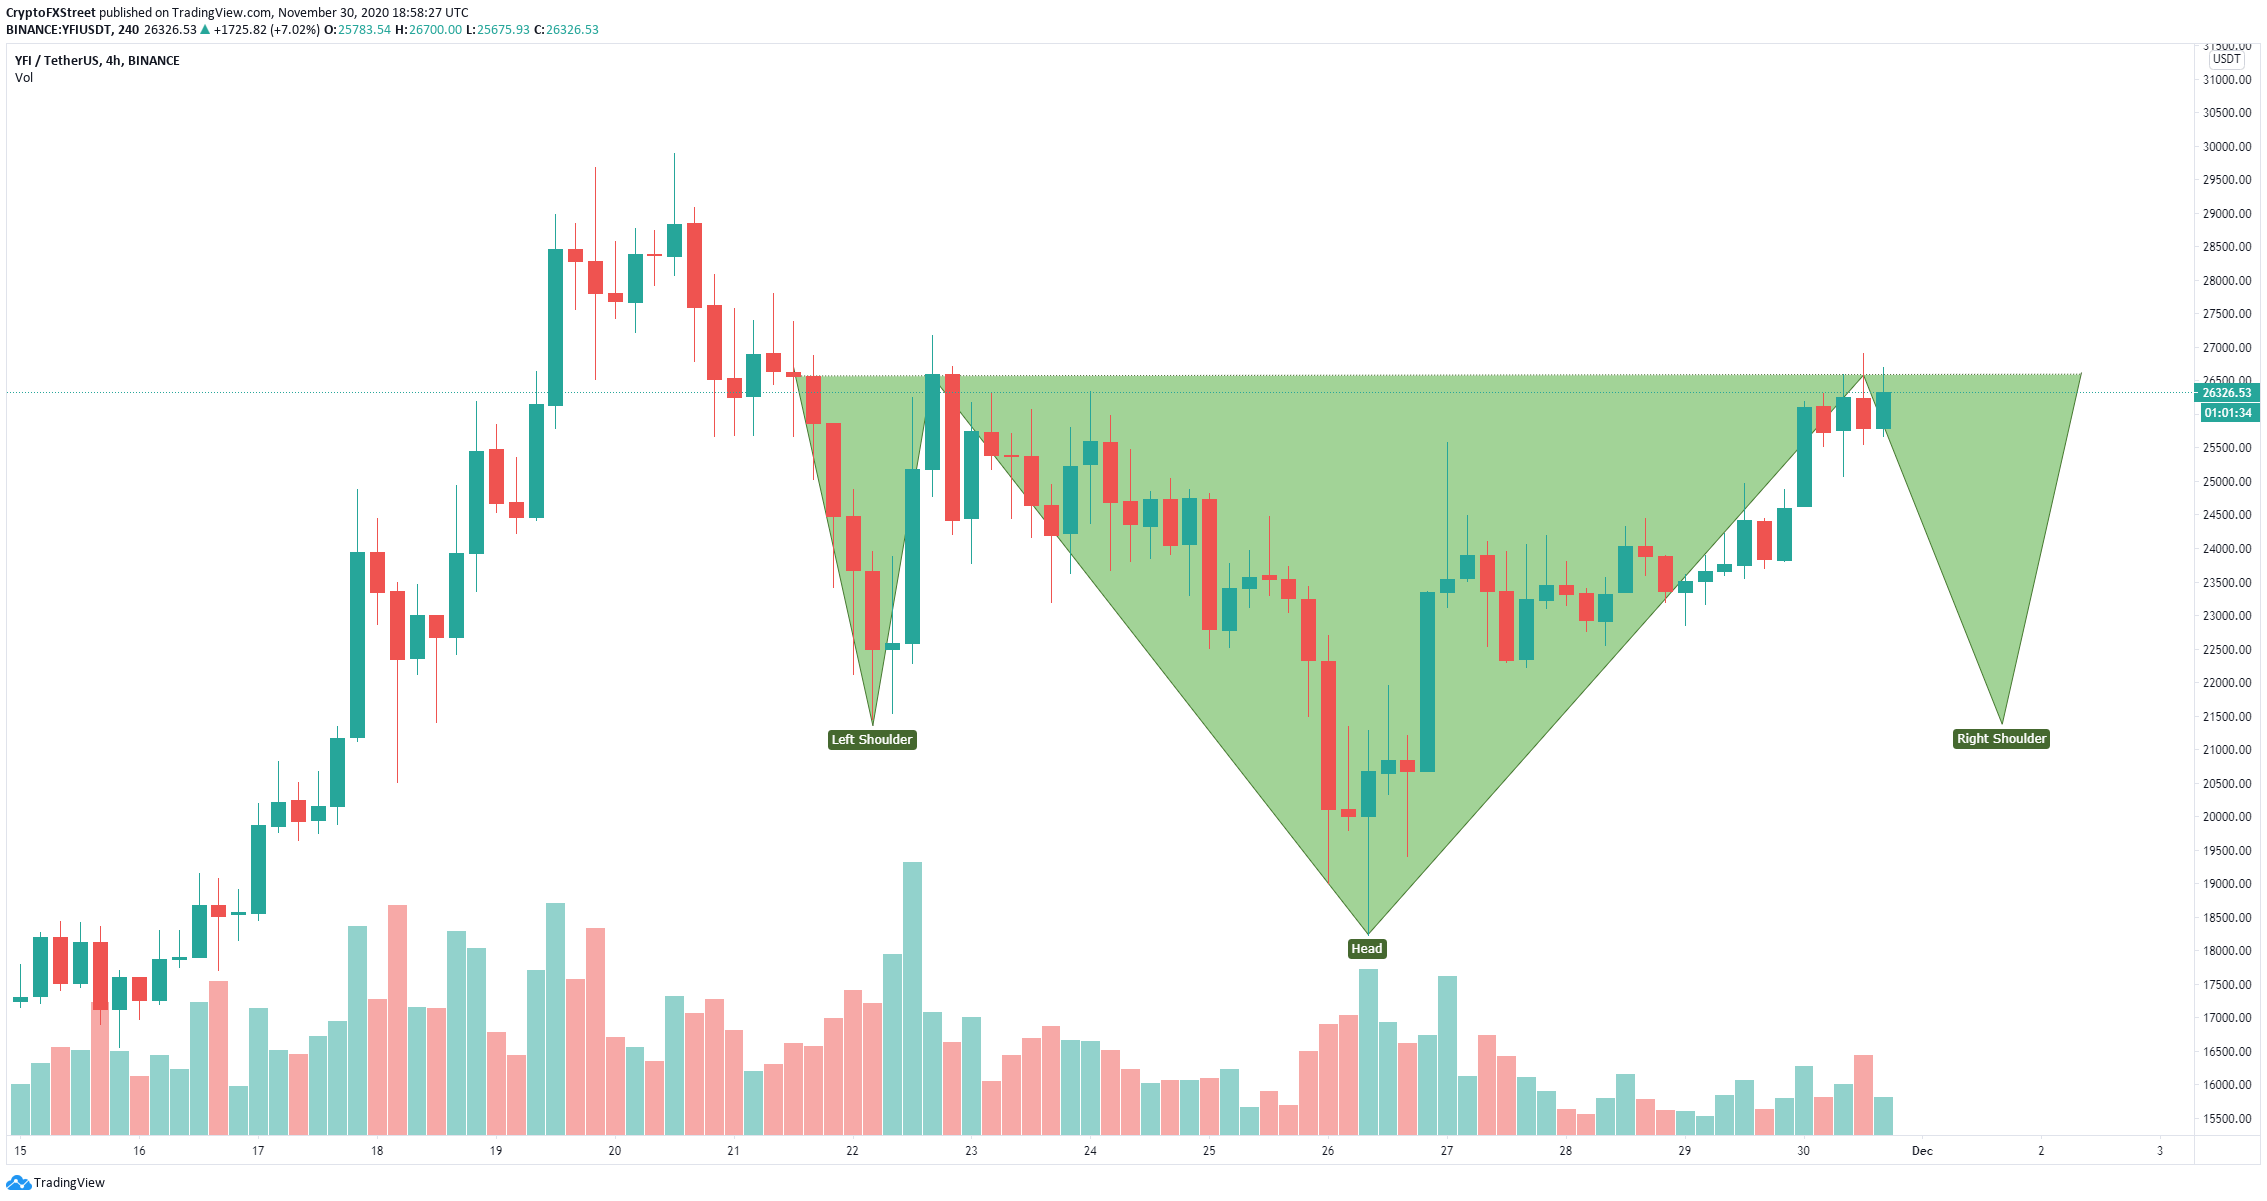
YFI/USD 4-hour chart
It also seems that the TD Sequential indicator is on the verge of presenting a sell signal on the 4-hour chart, currently showing a green ‘8’. This is a sign of even more selling pressure mounting on YFI in the short-term.
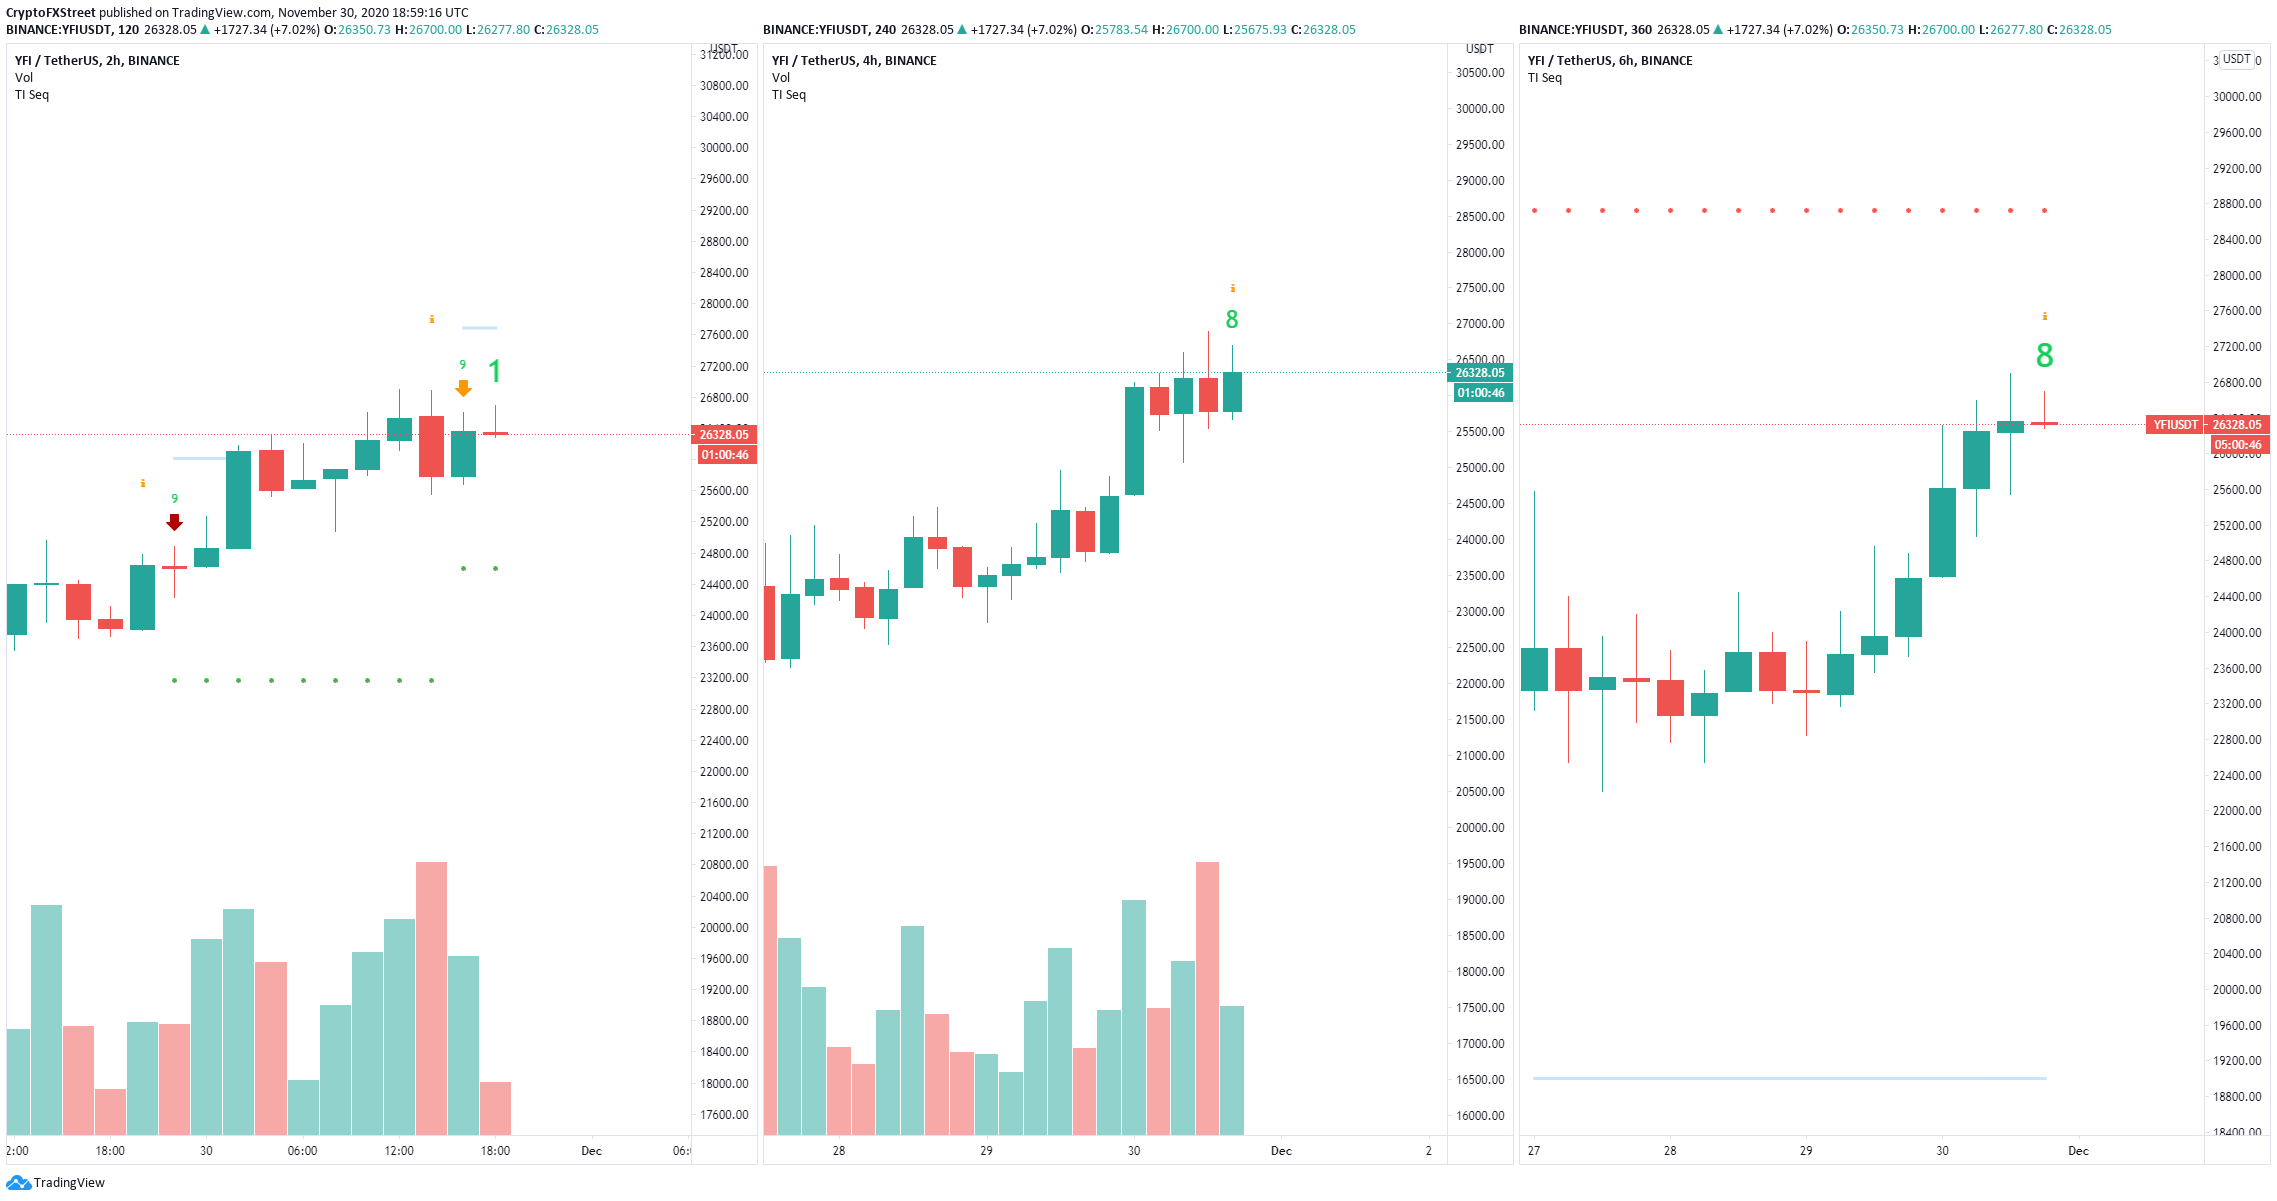
YFI Sell signals charts
Additionally, the TD Sequential has already presented a sell signal on the 2-hour chart and also posted a green ‘8’ on the 6-hour chart. Confirmation of all signals would drive Yearn.Finance price towards $22,000.
On the other hand, a strong breakout above the neckline at $26,600 should be considered a strong bullish signal, potentially driving Yearn.Finance towards the last high of November 20 at $29,890.
Author

Lorenzo Stroe
Independent Analyst
Lorenzo is an experienced Technical Analyst and Content Writer who has been working in the cryptocurrency industry since 2012. He also has a passion for trading.


