- Ripple continues to make headway, partnering with the second-largest bank in Oman, BankDhofar.
- The Ripple v. SEC lawsuit continues to rage as the respondent is requesting to depose six more witnesses.
- XRP price continues to rally higher but approaches an inflection point due to a stiff resistance zone.
Ripple partnerships in Asia continue to pour in despite its ongoing lawsuit with the US Securities & Exchange Commission (SEC). XRP price rally will face a formidable supply barrier that could make or break it.
Partnerships with Ripple sprout up despite US court case
The latest development with the payments company Ripple is its collaboration with Oman’s BankDhofar. This tie-up will open up a cross-border transfer channel between the bank in Oman and IndusInd, a private bank in India via the RippleNet.
The announcement blog further reads,
This partnership will enable cross-border transactions made via the BankDhofar Mobile Banking App to be processed instantly, reliably, cost-effectively and with end-to-end visibility anywhere in the world.
While Ripple continues to make headway by building value and paving a path toward facilitating efficient payments, the lawsuit brought forth by the SEC continues to take new turns.
In a recent development, the SEC is requesting Magistrate Judge Sarah Netburn to provide an order to depose a fresh batch of Ripple’s ex and current employees, despite the ten that are already set to testify on several matters related to the case.
To be specific, the recent requests include Ripple’s former CFO, Ron Will; Ethan Beard, the former senior vice president of Xpring; and a company representative to cross-verify and fill in the gaps in the testimony provided by these individuals.
XRP price approaches key zone
XRP price rallied nearly 22% over the past 18 hours, creating a swing high, but this move will be for nothing if it fails to slice through the supply zone that is present above it. This barrier extends from $1.094 to $1.183. Considering how the altcoins, including XRP, have rallied continuously by more than 50%, it is likely that a retracement will arrive soon.
If this hypothesis were to manifest, XRP price might likely face rejection from the resistance area at $1.094 and reverse its trend. In that case, investors can expect the remittance token to drop roughly 20% to the support level at $0.840.
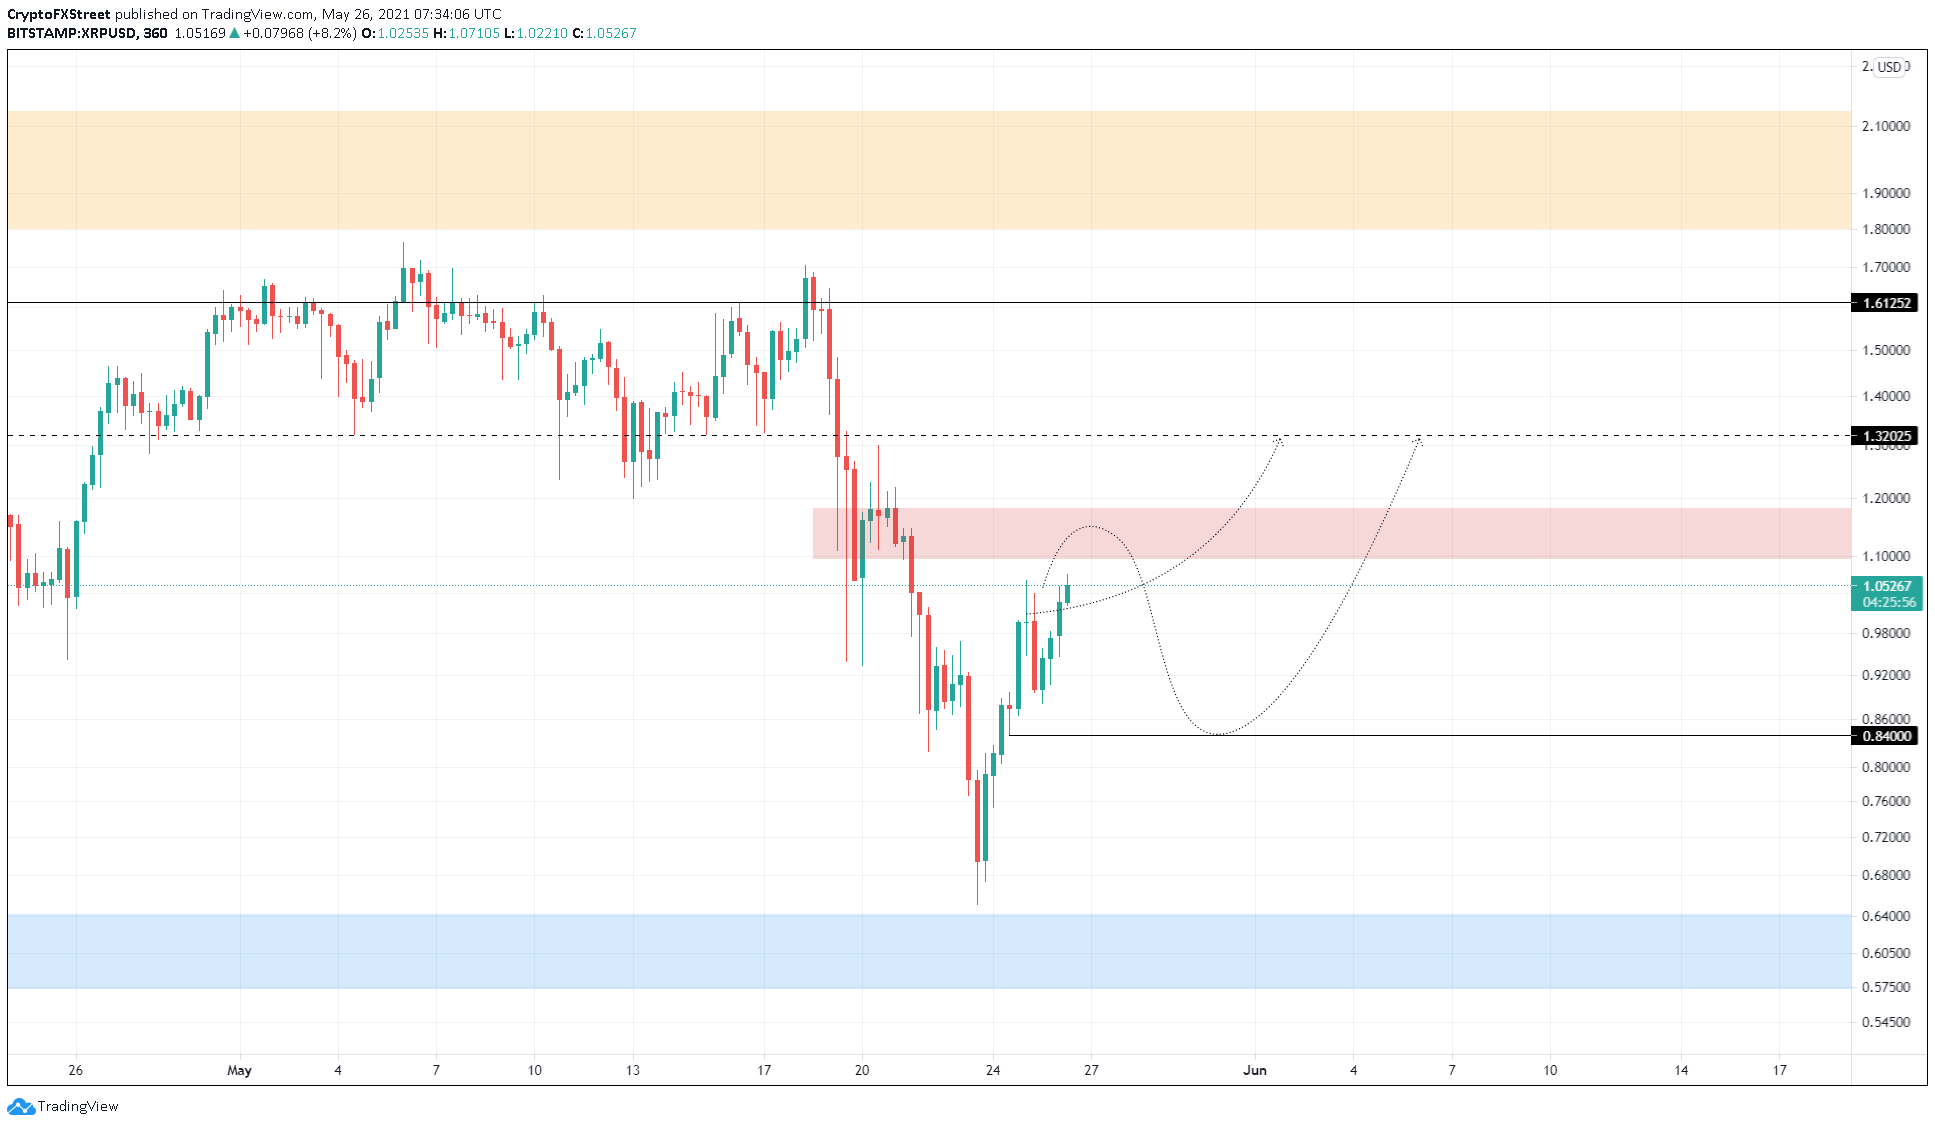
XRP/USD 6-hour chart
On the flip side, if XRP price manages to produce a decisive close above this ceiling, it will invalidate the bearish narrative and push Ripple up by 11% to tag the subsequent resistance wall at $1.320.
Information on these pages contains forward-looking statements that involve risks and uncertainties. Markets and instruments profiled on this page are for informational purposes only and should not in any way come across as a recommendation to buy or sell in these assets. You should do your own thorough research before making any investment decisions. FXStreet does not in any way guarantee that this information is free from mistakes, errors, or material misstatements. It also does not guarantee that this information is of a timely nature. Investing in Open Markets involves a great deal of risk, including the loss of all or a portion of your investment, as well as emotional distress. All risks, losses and costs associated with investing, including total loss of principal, are your responsibility. The views and opinions expressed in this article are those of the authors and do not necessarily reflect the official policy or position of FXStreet nor its advertisers. The author will not be held responsible for information that is found at the end of links posted on this page.
If not otherwise explicitly mentioned in the body of the article, at the time of writing, the author has no position in any stock mentioned in this article and no business relationship with any company mentioned. The author has not received compensation for writing this article, other than from FXStreet.
FXStreet and the author do not provide personalized recommendations. The author makes no representations as to the accuracy, completeness, or suitability of this information. FXStreet and the author will not be liable for any errors, omissions or any losses, injuries or damages arising from this information and its display or use. Errors and omissions excepted.
The author and FXStreet are not registered investment advisors and nothing in this article is intended to be investment advice.
Recommended Content
Editors’ Picks
Space ID price succumbs to selling pressure with $3.54 million worth of ID tokens unlocked in a cliff event

Space ID (ID) price remains bullish based on the Parabolic SAR price-tracking indicator, which continues to track ID price from below. However, the token is trading at a value that is significantly lower than its rate 24 hours ago, an outcome attributed to its scheduled token unlocks event.
Quant price maintains steady multi-month downtrend but 60% of QNT holders remain above water

Quant (QNT) price is trading with a bearish bias, a steady state that has prevailed for the most part of the year. Despite the downtrend, the majority of QNT token holders remain above water, sitting on unrealized profit.
Optimism receives backlash after decision to split 116 million OP tokens for treasury management

Optimism network recently announced the sale of 116 million OP tokens valued at around $162.4 million in a private sale to seven purchasers for treasury management. While the transaction was not expected to impact OP price, it has provoked backlash from onlookers.
Binance unintentionally causes Ethereum gas fees to soar 1,900% as hundreds of inactive wallets move ETH

With many transfers happening within a thin timeframe, Ethereum gas fees soared 1,900%, moving from 15 to around 300 Gwei. The same was reflected in simple Peer-to-Peer (P2P) transactions, which soared from the conventional 40 cents to around $10, data from Dune analytics shows.
Bitcoin: BTC contemplates crash in September

Bitcoin price remains unfazed by the US CPI announcement on September 13 and continues to move in a range. The weekly chart, however, shows a potential short-term recovery rally that could set the stage for a steep correction.