XRP Price Forecast: Ripple significantly undervalued, but timing not right
- XRP price trades below longstanding trend line originating in late December 2020.
- At Sunday’s low, Ripple had declined 67% from the April 14 high of $1.96.
- Market Value to Realized Value shows XRP price to be notably undervalued at current levels, waiting for buy signal.

XRP price distinguished itself as one of the high-flying cryptocurrencies in April as positive momentum began to build around the SEC case, but the crash in May has erased the April spike higher. Ripple faces several technical challenges that encourage a neutral outlook with a slight bearish tilt.
XRP price falls into legal uncertainty price range
Like all digital tokens, XRP price was overwhelmed by the selling contagion that enveloped the cryptocurrency market on May 19, pushing Ripple down 50% at the low of the day. The decline was highlighted by the smashing of the symmetrical triangle’s lower trend line, a test of the rising trend line from the December 2020 low at $0.87 and a test of the Fibonacci retracement of the advance also beginning in December 2020 at $0.85.
After rebounding and testing the May 13 low at $1.20, XRP price reverted to the downside that culminated with a sizeable decline on Sunday that pushed below the December 2020 rising trend line at $0.91 and the 61.8% retracement level at $0.85 before discovering support at the 200-day SMA at $0.65. In the process, Ripple also fell into an SEC legal uncertainty price range bounded by the November 2020 high at $0.78 and the December 2020 low at $0.17.
XRP price is now locked in a tight range with the upside resistance defined by the 61.8% retracement at $0.85, the April low at $0.87 and the rising trend line at $0.92. The downside is reinforced by the November 2020 high at $0.78 and then the 200-day SMA at $0.65
Things could change if XRP price can achieve a daily close above the rising trend line at $0.92. Above $0.92, there are no technical obstacles until the 10-week SMA at $1.12, followed by the May 13 low at $1.20. Of course, the confluence of the 50-day SMA at $1.35 with the previous symmetrical triangle lower trend line at $1.40 will cause problems.
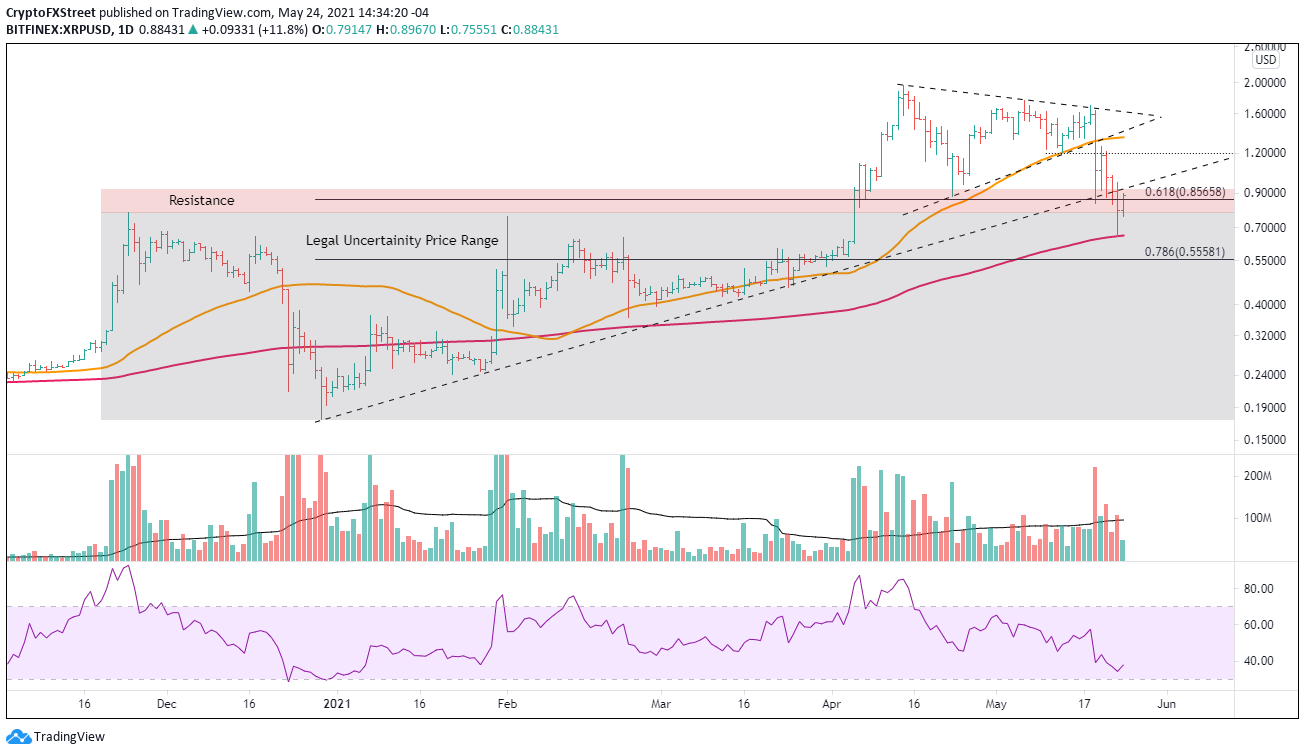
XRP/USD daily chart
On the downside, the 200-day SMA should contain renewed selling, but if the broader cryptocurrency complex unwinds further, XRP price may test the 78.6% retracement at $0.55.
The latest Santiment Market Value to Realized Value (MVRV) metric shows Ripple is significantly undervalued with a reading of -34.4%, equaling the level of the March 2020 crash.
At negative values, the MVRV metric means that short-term holders will realize higher profits than long-term holders if they sell at this moment, indicating an undervalued condition. Positive values indicate that long-term holders will realize higher profits than short-term holders, suggesting an overvalued market.
The extreme reading does not mean that investors should be buying Ripple today. It is not a timing tool by itself; however, if combined with a moving average, like a 7-period SMA as shown on the chart, investors can identify at least tactical opportunities and potentially long-term lows. Investors should wait for the metric to cross above the 7-period SMA to initiate a pilot buy in Ripple.
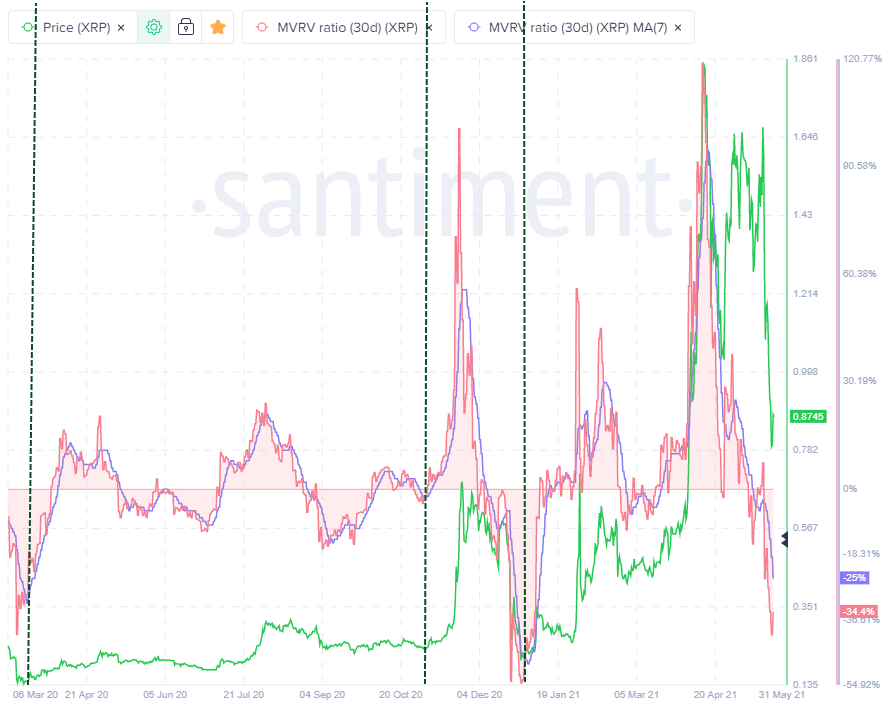
Santiment Market Value Realize Value (MVRV) metric
Based on the technical makeup of the daily chart and the current MVRV metric, Ripple investors are better served to practice some patience to let XRP prove itself.
Author

Sheldon McIntyre, CMT
Independent Analyst
Sheldon has 24 years of investment experience holding various positions in companies based in the United States and Chile. His core competencies include BRIC and G-10 equity markets, swing and position trading and technical analysis.


