XRP Price Prediction: How to avoid a smart money trap
- XRP price shows a massive accumulation pattern since May.
- Accumulation patterns can be referred to as catalysts before flamboyant bull runs occur.
- XRP price is near a significant resistance barrier which calls for prudent measures.

XRP price shows a W pattern that could catalyze a massive bull run. Still, there is a chance for a smart money fake out. Key levels have been defined.
XRP price at a make or break point
XRP price currently auctions at $0.395 as the bulls have produced a steep incline rally during the third trading week of September. The volume profile indicator shows an uptick in transactions throughout the 20% rally, which is an optimistic gesture that more gains will occur.
A Fibonacci projection tool surrounding the July 13 swing low at $0.30 and July 30 peak at $0.41. Then projected into the most recent swing low on September 6 at $0.319, shows the current uptrend rally at the 100% Fib level.
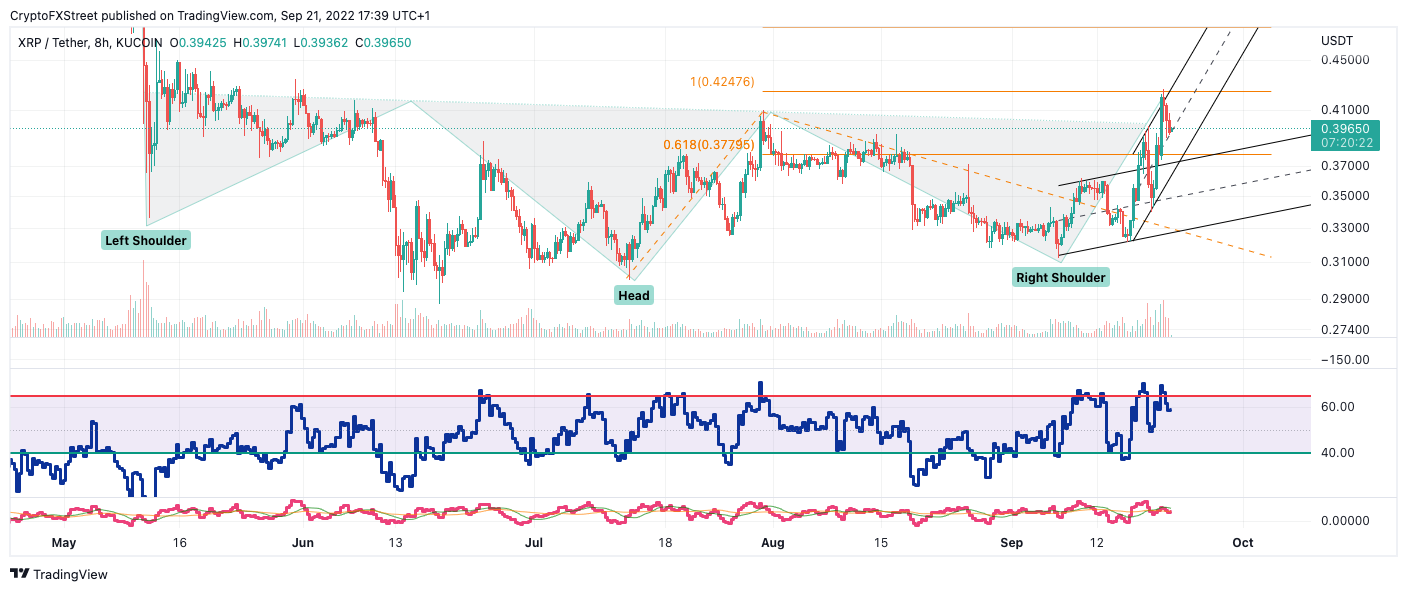
XRP USDT 8-Hour Chart
The bulls are struggling to close above the definitive $0.42 line in the sand. There also appears to be significant bearish divergence amidst the uptrend, which could be an early warning of a smart money fake-out.
The $0.42 level has been a level that rejected the XRP price on several occasions. On June 8, the XRP price tagged the level before falling 30% into the summertime low just hours later. On July 30, the XRP price tagged the same level, hinting at a breakout, but ultimately failed and fell 24% into the recent September swing low.
Thus exercising caution near the current price labels is justified. A safer entry for XRP traders will be to miss the first rally past $0.42 and wait for a retest if it occurs. Thus, avoiding a failed breakout trap currently looks pretty plausible.
In the following video, our analysts deep dive into Ripple's price action, analysing key market interest levels. -FXStreet Team
Author

Tony M.
FXStreet Contributor
Tony Montpeirous began investing in cryptocurrencies in 2017. His trading style incorporates Elliot Wave, Auction Market Theory, Fibonacci and price action as the cornerstone of his technical analysis.


