XRP price outlook grim as traders go short, exchange inflows increase
-
Net inflows to spot XRP centralized exchanges turned positive early Thursday after days of outflows, putting the token in focus following a record-breaking month for its DEX.
-
XRP is trading below key support levels, with immediate resistance at $2.49 and more around the $2.60 level.

Net inflows to spot XRP tokens turned positive early Thursday after days of outflows, putting the token in focus following a record-breaking month for its native decentralized exchange (DEX).
Over $15 million in XRP flowed to centralized exchanges on Thursday led by deposits to Bybit and Kraken, Coinglass data shows. Spot inflows to exchanges may mark an intention to sell tokens on the open market, dampening chances of a rally.
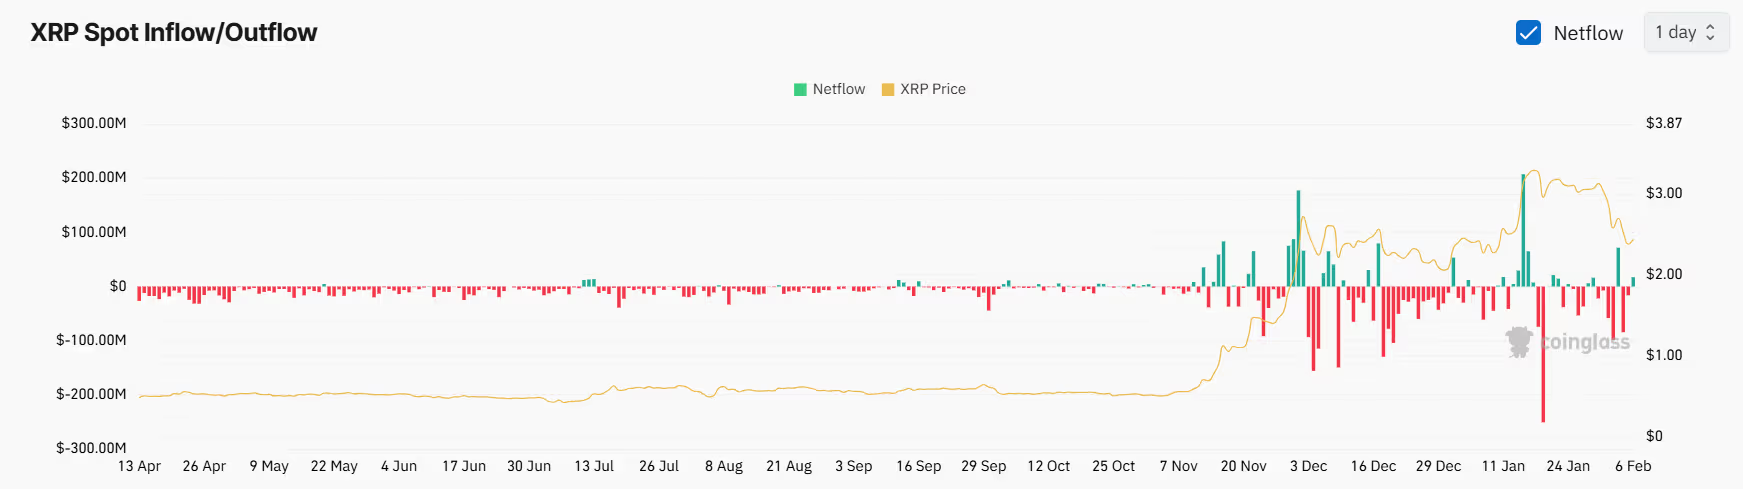
(Coinglass)
Meanwhile, 8-hour funding rates in the XRP perpetual futures markets stood at -0.0065% as of Thursday morning, implying a bias for short positions that profit from price drops. Notably, XRP's funding rates were more negative than ETH and BTC.
Negative funding rates mean traders holding short positions are willing to pay a small fee to those with long positions to keep their bearish bets open.
XRP below key averages
XRP trades below several key moving averages, with the 10-day exponential moving average (EMA) at $2.84 and 21-day EMA at $2.88. Trading below these moving averages suggests a bearish short-term outlook.
However, the 100-day simple moving average (SMA) is just above $2, and the 200-day SMA is at $1.30, both below the current price, indicating a bullish longer-term trend. Moving averages help identify trends by smoothing out price data, and the period readings used above are popularly used by retail traders.
Meanwhile, immediate resistance at $2.49, followed by the $2.60 level. A move past these levels would revive the bullish outlook, setting the stage for a run to the $3 mark, which it breached in January for the first time since 2018.
XRP's 14-day relative strength index (RSI) — which measures magnitude of price changes — was just over 36 in Asian hours, placing it in the neutral zone. Traditionally, RSI values above 70 indicate overbought conditions, while values below 30 suggest oversold conditions. An RSI around 50 is considered neutral.
Author

CoinDesk Analysis Team
CoinDesk
CoinDesk is the media platform for the next generation of investors exploring how cryptocurrencies and digital assets are contributing to the evolution of the global financial system.


