XRP losses mount as traders digest Hinman documents
- XRP price has dropped 17.4% below its June 15 peak of $0.5649 after Hinman documents release.
- The next major barrier stands at $0.54, and XRP would need to chart a 15% gain in order to breach it.
- Ripple proponents and XRP community of holders argue that SEC executives offered Ether safe passage while prosecuting Ripple.

XRP price nosedived 17.4% since the $0.5649 high registered on Tuesday as market participants digested the contents of Hinman documents, released earlier in the week. These documents, a key element for Ripple’s lawsuit against the US Security and Exchange Commission (SEC), include internal messages, emails between SEC executives, and a detailed insight into the regulator’s stance on how decentralized crypto assets need to be so they are considered securities.
The lawsuit between the SEC and Ripple is one the main factors moving XRP price. Initially, the release of the Hinman documents caused XRP to rally as they seemed to support Ripple’s cause, but once investors digested the documents uncertainty and fear outweighed the initial euphoria, leading to a decline in the altcoin’s price.
At the time of writing, XRP is trading at $0.4802 on Binance.
Also read: XRP price settles above $0.50, wiping out gains from Hinman documents release
Hinman documents release leaves doubts
The release of Hinman documents started a debate in the crypto community on whether XRP is or isn’t a security.
Moreover, other legal documents suggest that Ripple paid millions of dollars to exchanges to list XRP in them. Faced with these accusations, Ripple CTO David Schwartz thwarted the claims and labeled them as “misrepresentation of allegations as facts”.
This tweet misrepresents allegations as facts https://t.co/twJ1CjUGLq
— David "JoelKatz" Schwartz (@JoelKatz) June 14, 2023
From a technical perspective, the altcoin looks primed for further price decline. XRP price is currently in an upward trend that started on March 15, 2023. Since then, the altcoin climbed to its peak of $0.5843, on March 29. XRP attempted a recovery to the March 29 peak and touched a high of $0.5649 on June 15, Tuesday, the day Hinman documents were released.
XRP price is currently below two long term Exponential Moving Averages, the 10-day and 50-day EMAs at $0.5061 and $0.4871 respectively. These two levels could act as immediate resistance for the altcoin, once it begins its recovery. The next key resistance level is $0.4912, XRP price stayed below this level since mid-April 2023.
The 200-day EMA at $0.4509 is a key support level for XRP. The 50% and 61.8% Fibonacci levels of the asset’s climb from March lows to the $0.5843 peak are two key supports for XRP, at $0.4708 and $0.4440 respectively.
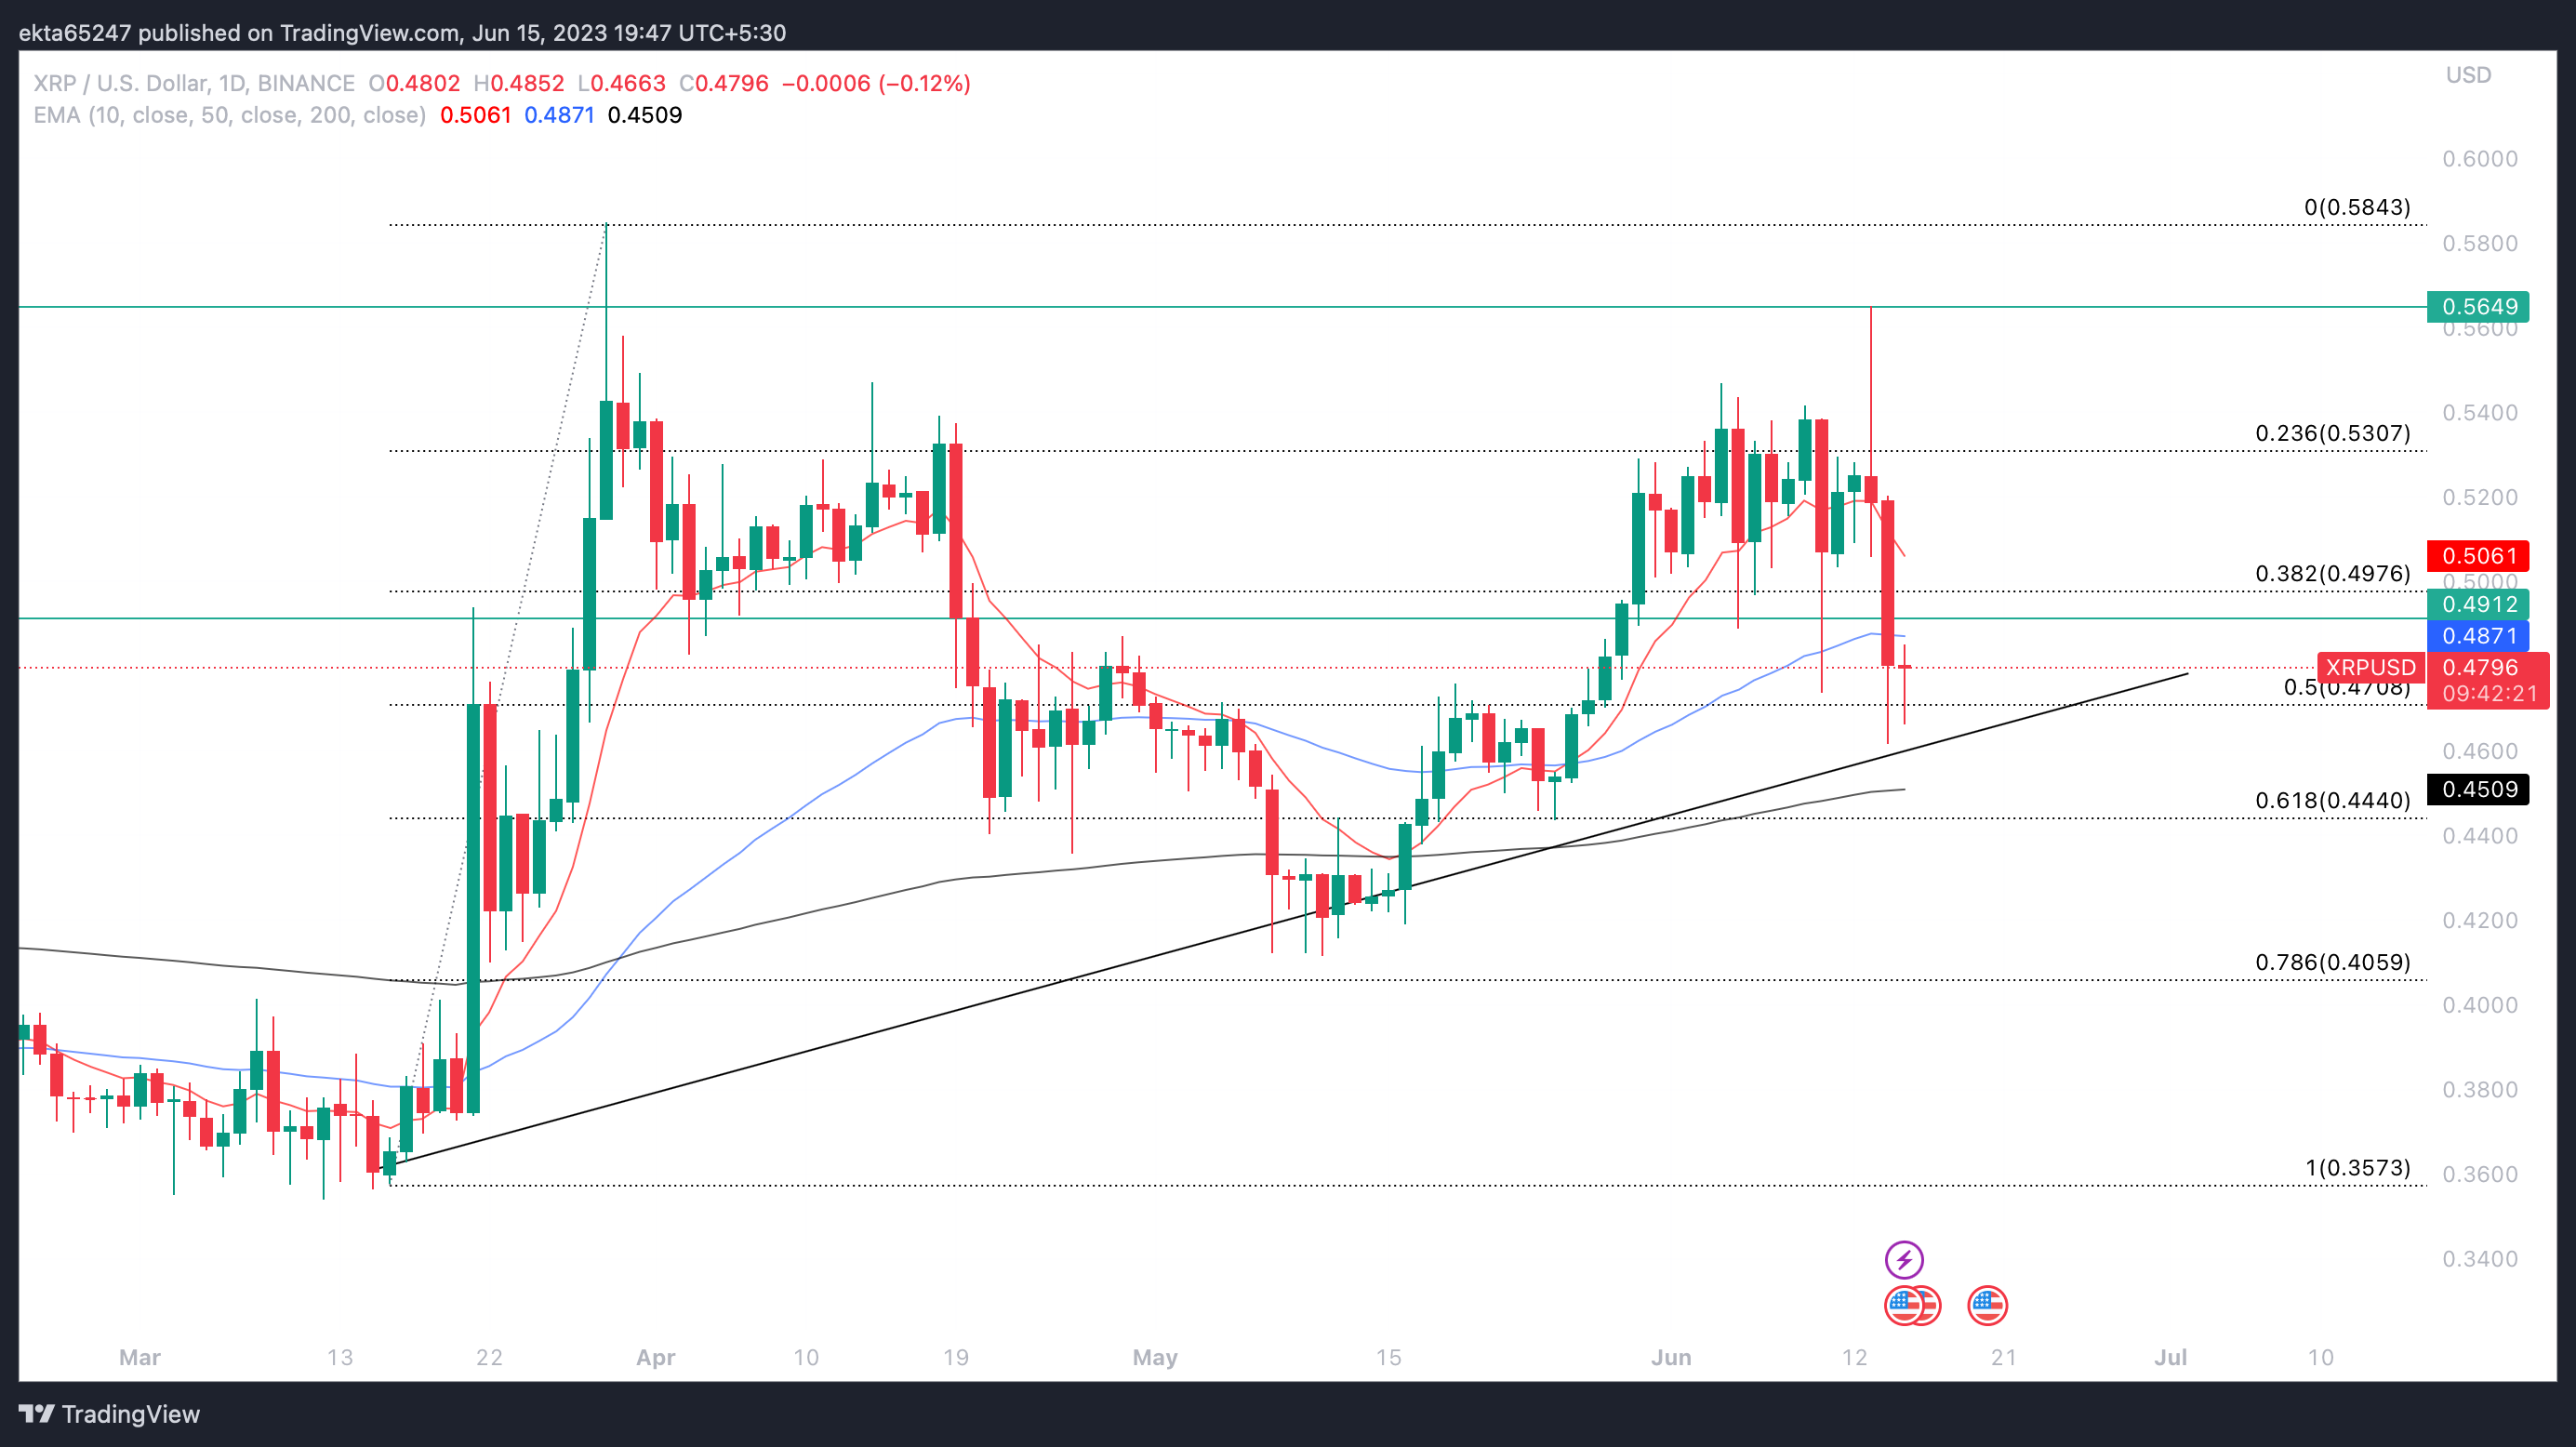
XRP/USD one-day price chart
A decisive close below the trendline, is likely to confirm a bearish trend reversal in XRP.
Author

Ekta Mourya
FXStreet
Ekta Mourya has extensive experience in fundamental and on-chain analysis, particularly focused on impact of macroeconomics and central bank policies on cryptocurrencies.


