|

XRP price action warns of a possible 50% price collapse

  • XRP price is at the end of a long-term bearish pattern.
  • Multiple indications that XRP could break down even further.
  • Upside potential exists but is increasingly unlikely to occur.

XRP price action on the weekly chart looks depressing if you’re a bull but magical if you’re a bear. No matter which way you want to look at it, XRP’s chart is bearish and warns of a massive collapse unless bulls come in and reverse the current setup.

XRP price could smash through $0.50 to $0.25

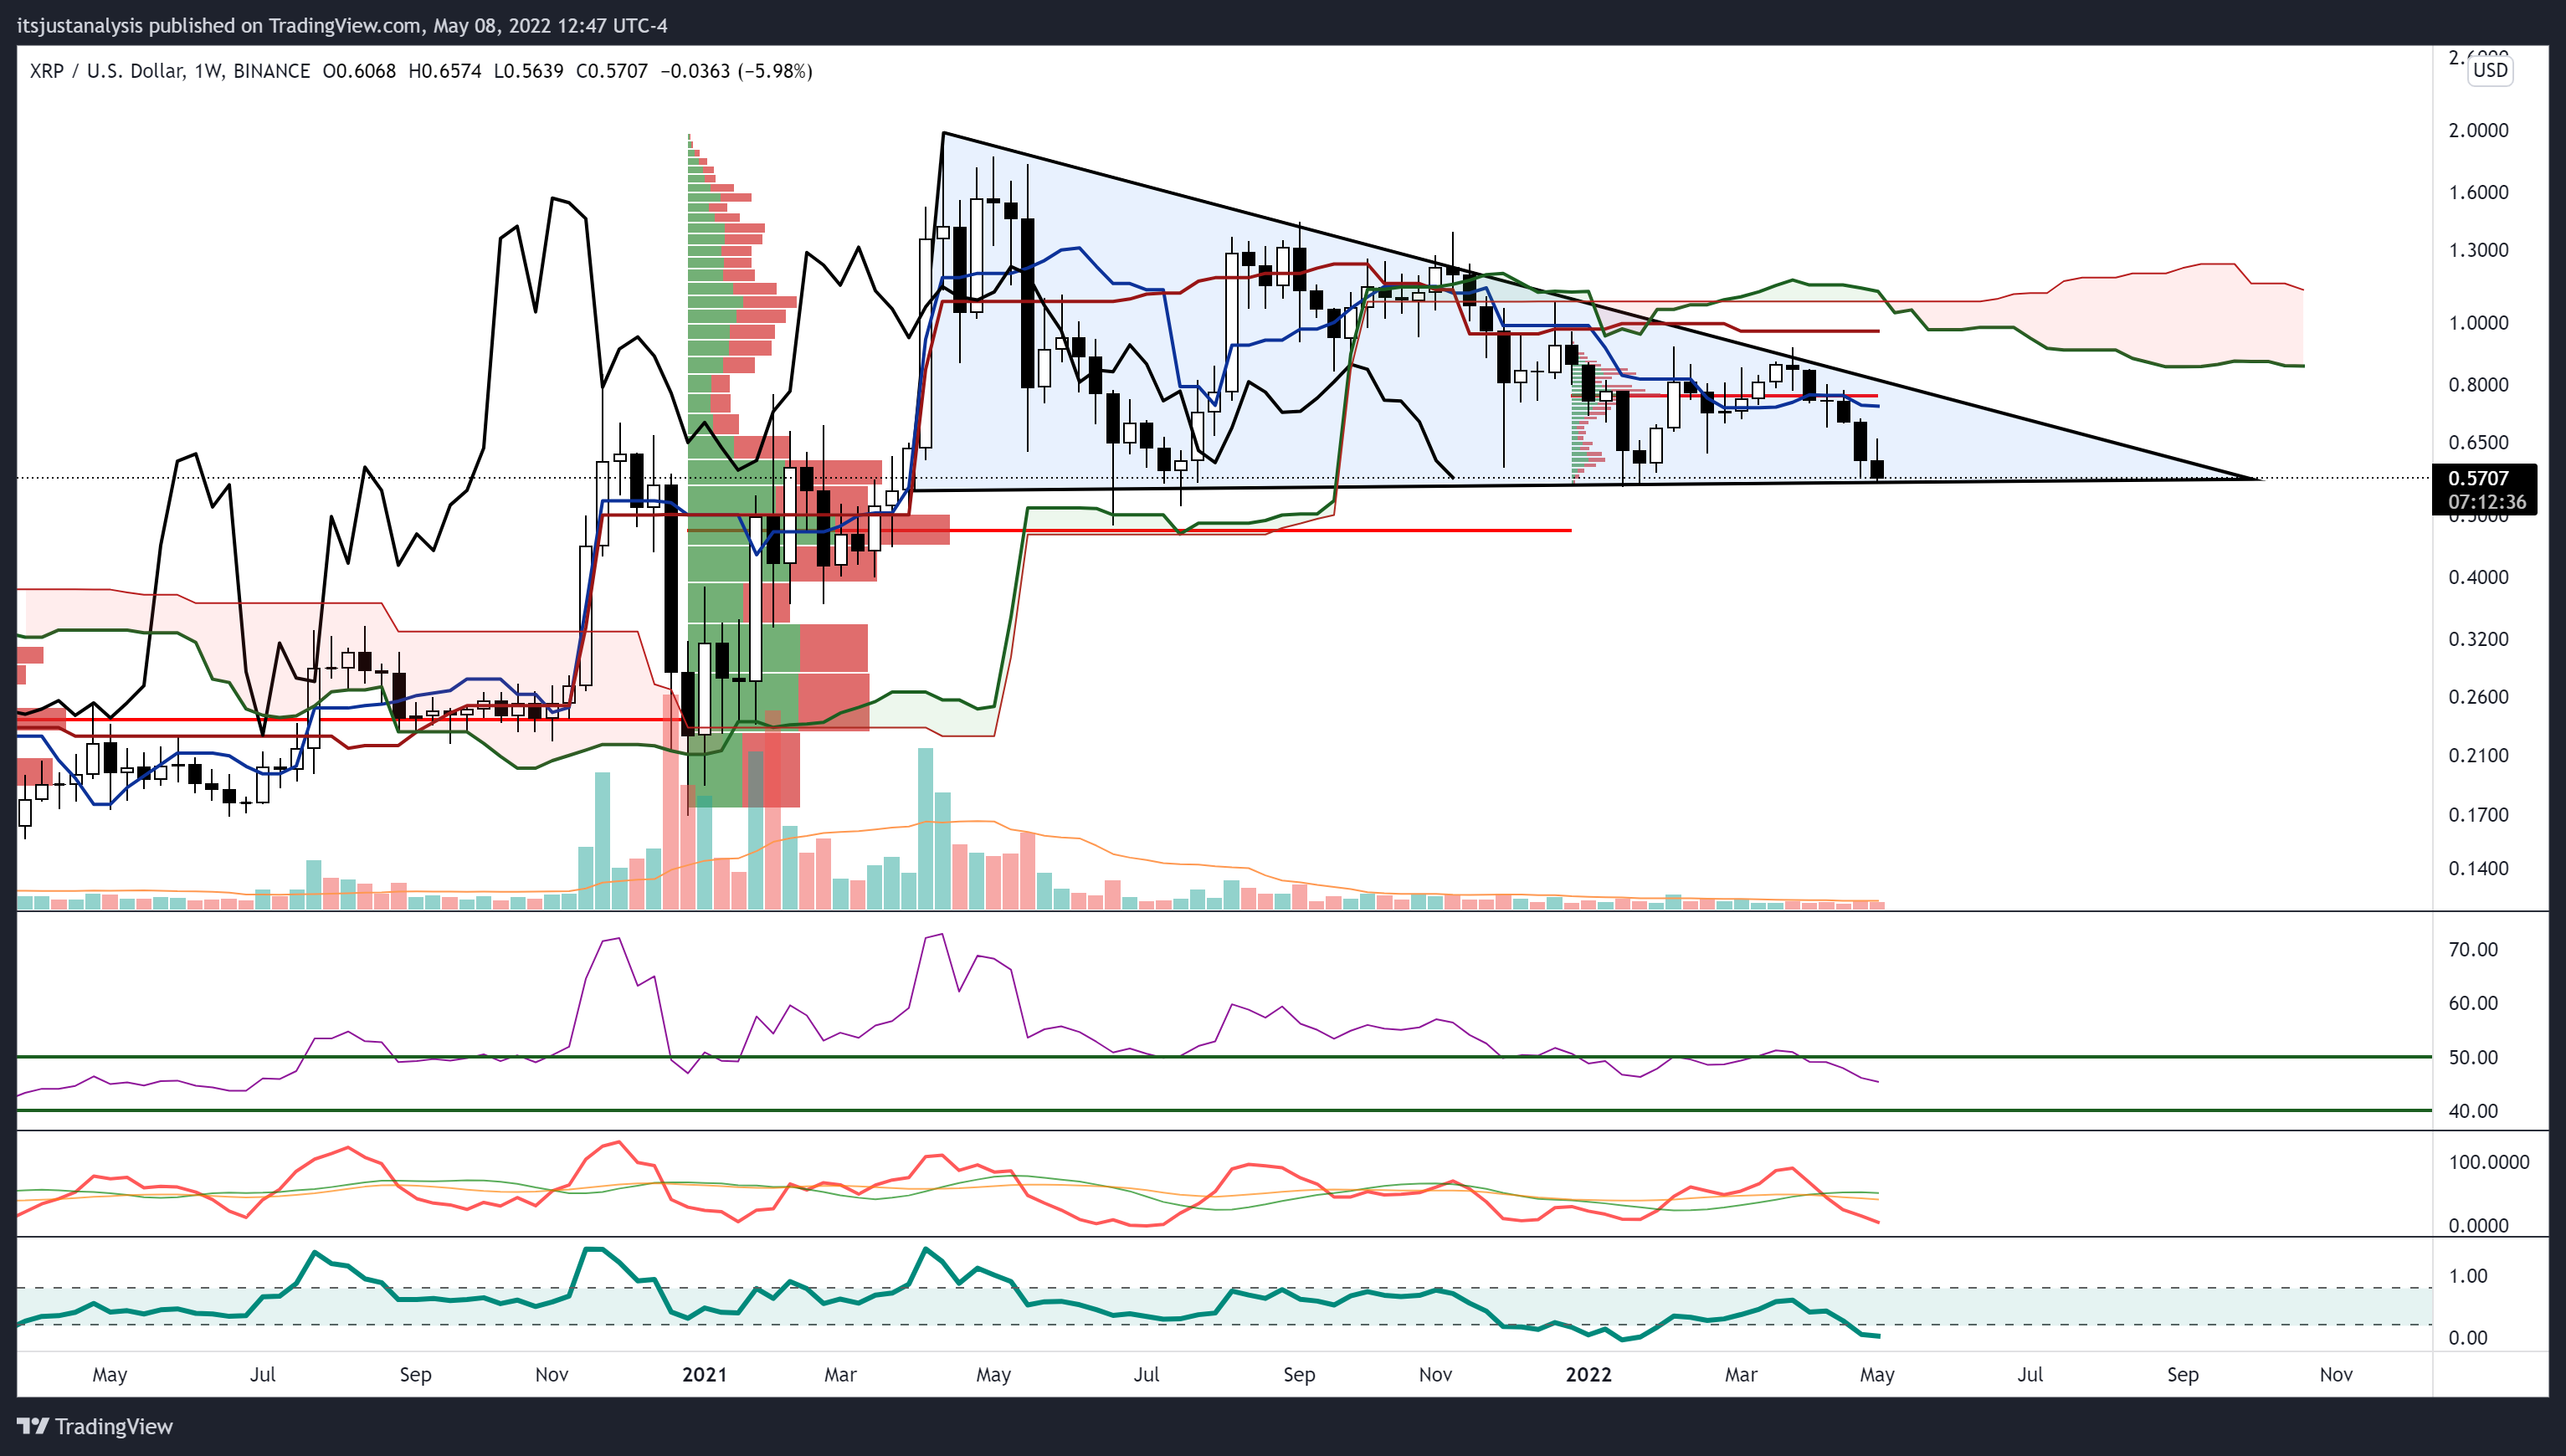
XRP price is currently inside a descending triangle pattern. The descending triangle pattern is one of the most bearish standard patterns in technical analysis. Whether it shows up (uptrend or downtrend), it is overwhelmingly bearish in nature.

With any triangle pattern, some behaviors are expected. The universal behavior is that any breakout from a triangle often occurs within the final third of the pattern – which is where XRP price is currently at.

Upon any successful close below the descending triangle, XRP price could flash crash to the 2020 Volume Point of control at $0.25. However, there is a possibility that a major fakeout may develop instead.

Below the bottom of the descending triangle is the 2021 Volume Point of Control at $0.48. A high-volume node from 2020 is also in the $0.48 value area. Another reason for the major fakeout and bear trap is the presence of a Kumo Twist.

Kumo Twists in the Ichimoku system can often identify where new swing highs and lows may form – especially if an instrument has been trending into the Kumo Twist.

XRP/USDT Weekly Ichimoku Kinko Hyo Chart

False breakouts from triangle patterns are very common. Most conservative pattern traders ignore the initial breakout from a triangle and wait for the retest to confirm the breakout or capitalize on the trap that forms when price returns inside the triangle and moves to the inverse of the original breakout. In that scenario, XRP price would be well on its way to retest the $0.75 and $1.00 value area.

Author

Jonathan Morgan

Jonathan Morgan

Independent Analyst

Jonathan has been working as an Independent future, forex, and cryptocurrency trader and analyst for 8 years. He also has been writing for the past 5 years.

More from Jonathan Morgan
Share:

Markets move fast. We move first.

Orange Juice Newsletter brings you expert driven insights - not headlines. Every day on your inbox.

By subscribing you agree to our Terms and conditions.

Editor's Picks

Pi Network Price Forecast: Bearish streak nears critical support trendline

Pi Network (PI) edges lower on Friday for the third consecutive day, approaching a local support trendline. The on-chain data suggests an increase in supply pressure as Centralized Exchanges (CEXs) experience a surge in inflows.

Top Crypto Gainers: Zcash rallies as MYX Finance, Dash test critical EMA levels

Zcash , MYX Finance, and Dash are the top-performing assets in the top 100 cryptocurrency list over the last 24 hours. The privacy coin leads the rally while MYX and DASH struggle to clear their 100-day Exponential Moving Averages (EMA).

XRP slides amid record on-chain activity, mixed technical signals

Ripple is trading under pressure at the time of writing on Thursday, after bulls failed to break the short-term resistance at $2.22. The reversal may extend toward Monday’s low of $1.98, especially if risk-off sentiment persists in the broader cryptocurrency market.

Aster lags recovery as perpetual DEX releases new roadmap on infrastructure, utility and ecosystem 

Aster is consolidating above $1.05 at the time of writing on Thursday, reflecting lethargic sentiment in the broader cryptocurrency market. The token native to the perpetual DEX had recovered from Monday's low of $0.88 but stalled around $1.08 on Wednesday.

Orange Juice Newsletter – Smart insights by real people. Every day.

A free newsletter highlighting key market trends to help traders stay a step ahead. Daily insights on the most relevant trading topics, compiled by our experts in an easy-to-read format so you never miss an important move.

Bitcoin: BTC steadies as data suggests local bottom

Bitcoin (BTC) hovers around $91,000 at the time of writing on Friday, extending its recovery by 5% so far this week. On the institutional front, a modest outflow from US-listed spot Bitcoin Exchange Traded Funds (ETFs) marks a slowdown from previous weeks and signals a reduction in selling pressure, further supporting BTC’s recovery.