XRP holds key support while indicators point to short-term recovery
- Ripple started a recovery wave above a key support level of $1.024.
- XRP price started an upside correction as indicators suggest a short-term recovery.
- The coin may initiate a fresh downtrend upon a breakout of the $1.024 support level.

XRP is in the process of forming a triple bottom price pattern boding more upside, for the pair priced against the US dollar., XRP price recently found support at the pattern’s base during the formation of the third bottom. Now, Ripple is at a crossroads – a spike in selling pressure may drive a bearish breakout, whilst technical indicators signal a bullish reversal. It all depends on whether or not a critical support level holds.
XRP rejected above the triple bottom at $1
XRP has found support above $1.024 and started a bullish recovery similar to peer altcoins. The XRP price has found footing at the $1.024 level for the third time making it a triple bottom pattern.
If there is increased demand at the current price level it will push the XRP price towards its double top level at $1.108. However, the 20 and 50-period exponential moving averages may act as minor hurdles at $1.076 and $1.108.
The MACD has closed the first histogram above the 0 mark, indicating a bullish reversal. While the RSI is still holding at 44, a crossover above 50 may encourage investors to go long. In that case, the XRP price might spike towards $1.165. Additional gains could lift the price towards the next key hurdles at $1.218 or $1.284
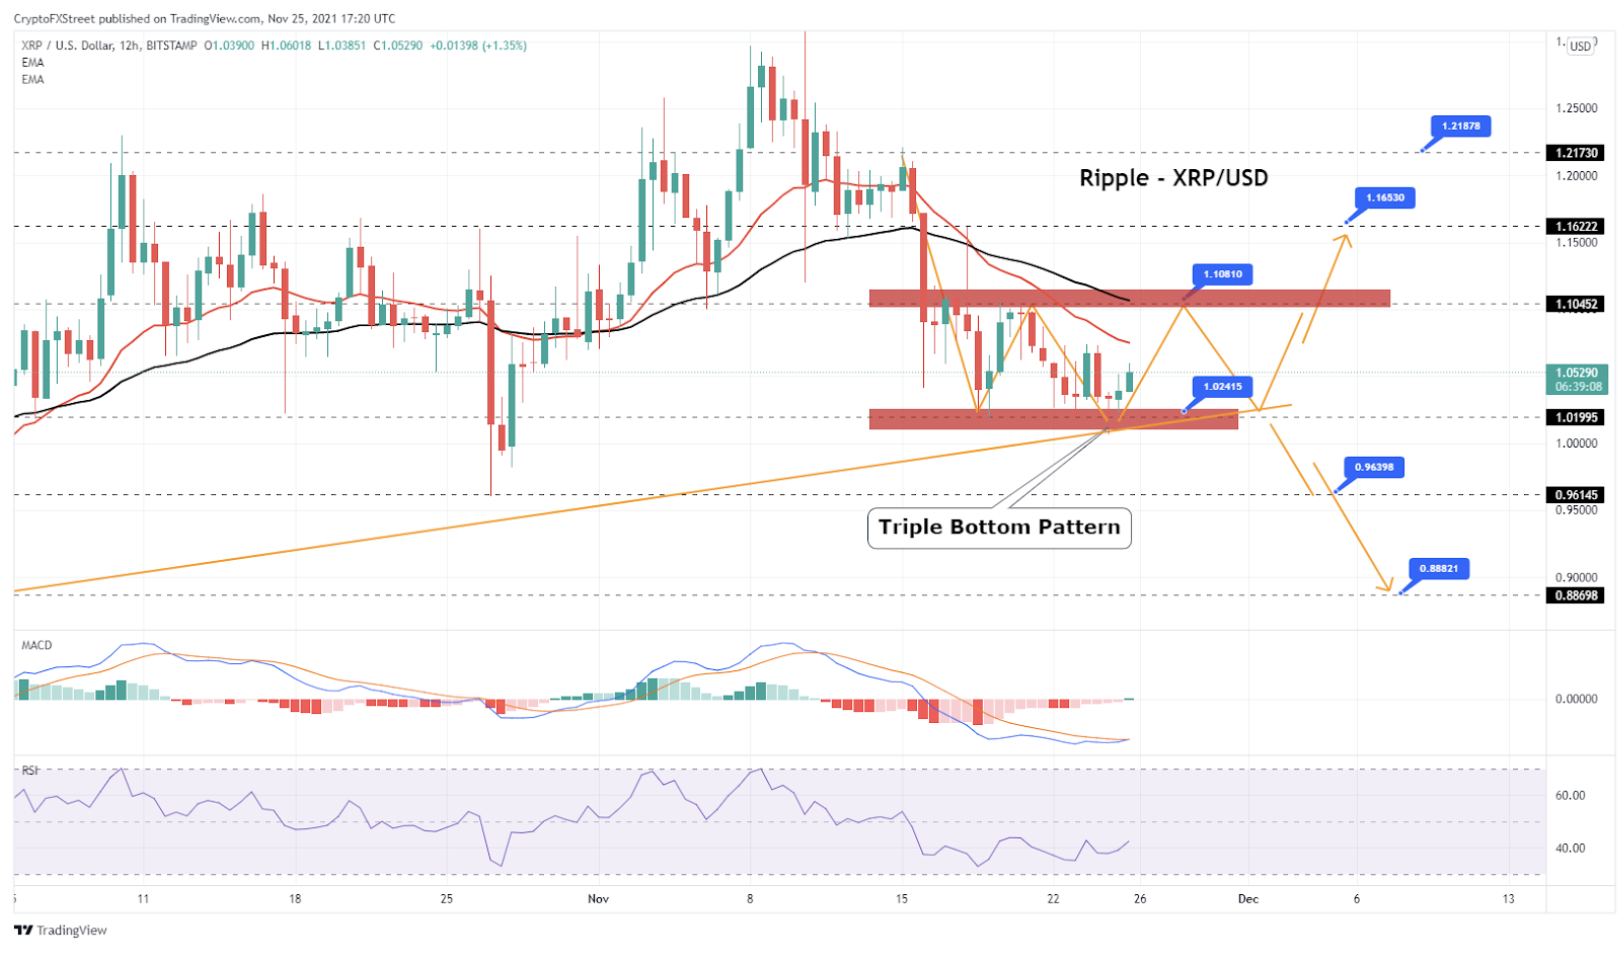
XRP 12-hourly chart - Triple bottom to drive uptrend
If XRP disappoints to start a new spike above the $1.081 level, it could extend losses. Initial support on the downside is near the $1.024 level.
The upward trend that started on September 21 also extends to significant support at the $1.024 mark. Therefore, a break below the $1.024 support level might push the price further down. The next critical support level is near $0.963, below which the price may fall to the $0.888 level.
Author
FXStreet Team
FXStreet
Composed of a group of economic journalists and FX experts, the FXStreet content team produces and oversees all content published on FXStreet. It provides a purely journalistic approach to the Forex market.


