XRP Elliott Wave technical analysis [Video]
![XRP Elliott Wave technical analysis [Video]](https://editorial.fxstreet.com/images/Markets/Currencies/Cryptocurrencies/Coins/Ripple/ripple_XtraLarge.jpg)
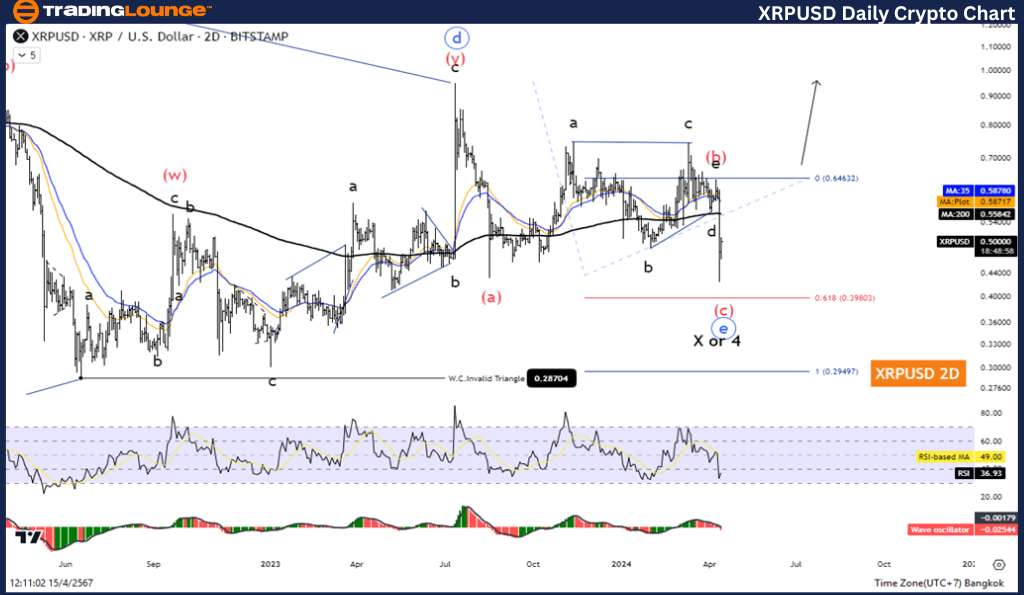
Elliott Wave Analysis TradingLounge Daily Chart.
XRP/ U.S. dollar(XRPUSD).
XRP/USD Elliott Wave technical analysis
Function: Counter Trend.
Mode: Corrective.
Structure: Triangle.
Position: Wave E.
Direction next higher degrees: Wave 4 of Impulse.
Wave cancel invalid level: 0.486.
Details: The Moved in Triangle Before Increase again
XRP/U.S. dollar(XRPUSD)Trading Strategy:
Triangle correction, where we are in the final phase of the correction in Wave E. Once Wave E is complete, the price will return to the uptrend again.
XRP/ U.S. dollar(XRPUSD)Technical Indicators: The price is above the MA200 indicating a Downtrend, The Wave Oscillator is a Bearish Momentum.
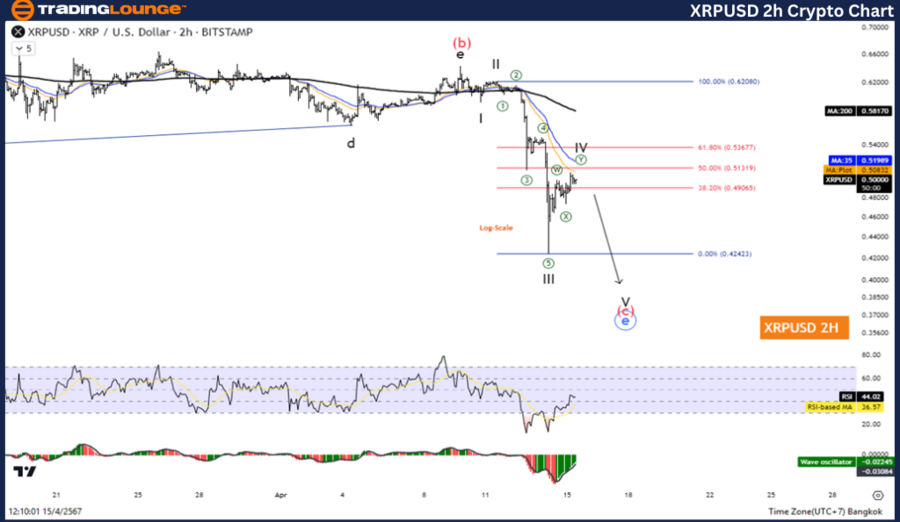
Elliott Wave Analysis TradingLounge 2H Chart,
XRP/ U.S. dollar(XRPUSD).
XRP/USD Elliott Wave technical analysis
Function: Follow Trend.
Mode: Motive.
Structure: Impulse.
Position: Wave 4.
Direction next higher degrees: Wave C of Zigzag.
Wave Cancel invalid level:
Details: A short-term pullback in wave 4 before falling again in wave 5.
XRP/ U.S. dollar(XRPUSD)Trading Strategy:
Decreasing in an impulse pattern where we are in a short pullback in wave 4 before falling again in wave 5 to complete wave C and after which the price re-enters the uptrend.
XRP/ U.S. dollar(XRPUSD)Technical Indicators: The price is above the MA200 indicating a Downtrend, The Wave Oscillator is a Bearish Momentum.
Technical analyst: Kittiampon Somboonsod
XRP/USD Elliott Wave technical analysis [Video]
Author

Peter Mathers
TradingLounge
Peter Mathers started actively trading in 1982. He began his career at Hoei and Shoin, a Japanese futures trading company.


