XRP breaks all-time highs: What’s driving the rally?

XRP broke into new all-time highs yesterday, following a decisive breakout above the $3.40 level. In this update, we’ll break down the technical picture across multiple timeframes and explore the key fundamental catalysts driving this move.
Breakout confirmed on the daily chart
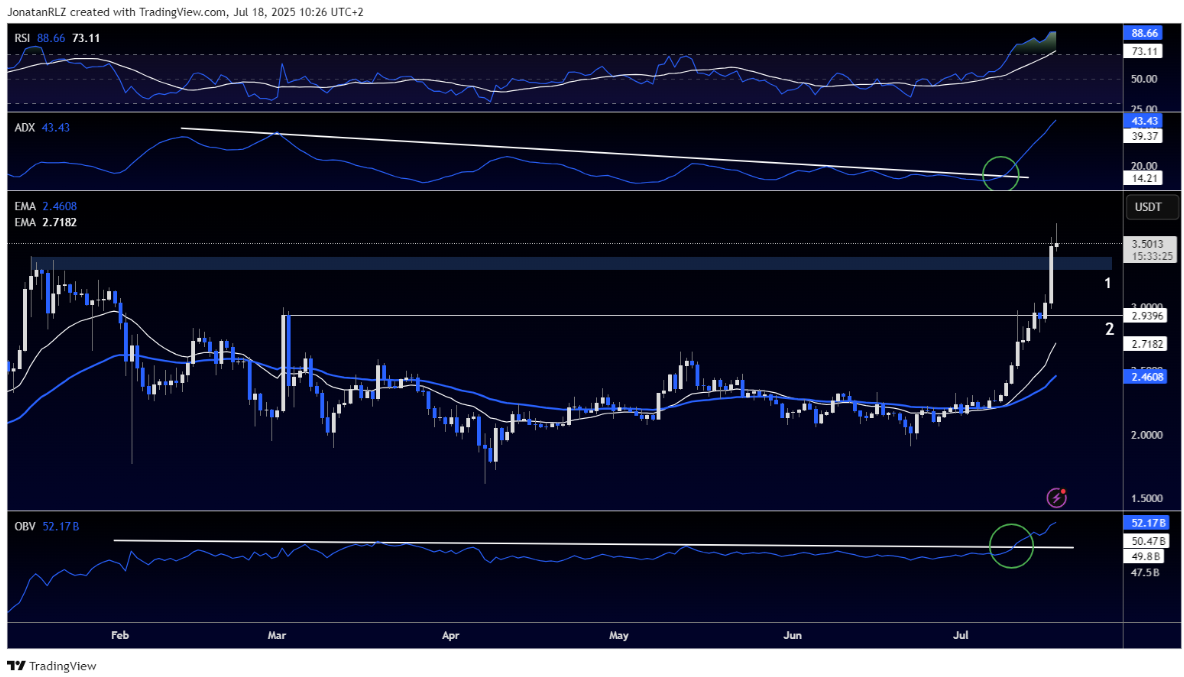
XRP had a good breakout day yesterday, closing well above its previous all-time high level of around $3.40. Now, at the time of writing, the price is holding at around $3.50, and the daily candle has set the breakout solidly.
The Relative Strength Index, or RSI, is technically in the overbought zone but remember context is king. XRP has had sustained times in overbought levels in strong trends before and this may be no different.
From the perspective of the Average Directional Index (ADX), what we can see is that earlier this month it broke up above a long-term trendline, which meant a shift in trend strength. The break confirms that we are now in a bullish strong phase, where ADX validates the momentum from the break.
At the bottom of the chart, the On-Balance Volume (OBV) shows buyers stepping in with force. OBV has broken above a significant long-term level, further validating that bullish momentum has taken control. This aligns well with the price action we’re seeing on the daily chart.
We’ve identified two potential support zones should the price pull back. The first is the previous all-time high range between $3.30 and $3.40, which will be a likely natural retest area. Below that, the $2.90–$3.00 range is a second major support, particularly because the daily 20EMA (white) and 50EMA (blue) are still on their steep rise. Soon, in the next few days, the 20EMA will most probably be closing in on this lower support, adding confluence to the zone in the event of a deeper retracement.
For now, there are no signs on the daily timeframe that this breakout is losing steam. Combined with the fundamental tailwinds we’ll discuss later, there is reason to believe this may be the start of a high-timeframe bullish expansion for XRP.
Retracement zones to watch on lower timeframes
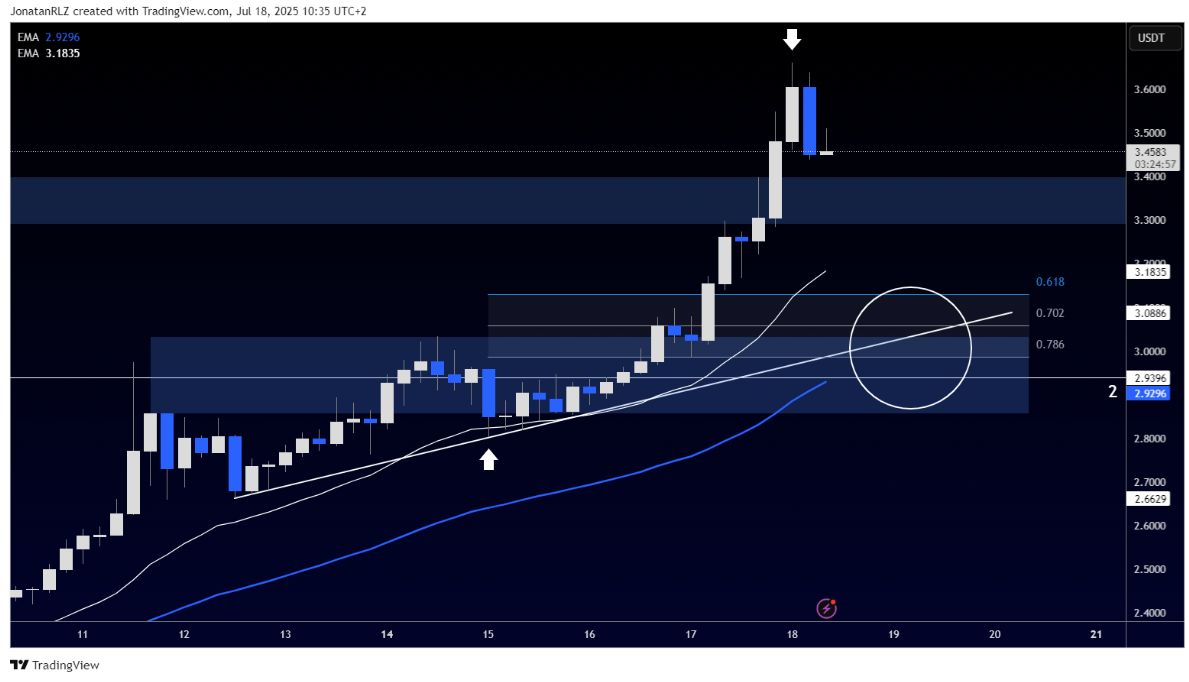
On the 4-hour chart, XRP has an evident structure that gives context to the recent breakdown. Using the Fibonacci retracement tool, whose anchor is from the start of the breakdown move to the recent high (anchor points indicated with the white arrows on the chart), we can ascertain likely zones of retracement.
We’ve also added a trendline and plotted the 4-hour 20EMA and 50EMA. Notably, there is a confluence area where the trendline, the “reload zone” (the area between the 0.618 and 0.786 Fibonacci retracement levels), and the moving averages all converge. This zone sits right around the $3.00 mark and aligns with the second support level highlighted in the daily chart analysis.
If there's a reversal of the current breakout move, then the $3.00 area would be a good place to support fresh upward moves. But until then, price is still above the previous all-time high level, and as long as this is the case, initial focus is on continuation higher.
Regulatory tailwinds boost XRP’s momentum
Yesterday, on July 17, the U.S. House passed the GENIUS Act, a comprehensive framework for U.S.-dollar stablecoins, in a landslide 308–122 bipartisan vote. The landmark bill requires issuers to hold dollar-for-dollar reserves in liquid assets and submit to ongoing transparency obligations. The Senate already approved it 68–30 last month. For XRP, which has been plagued by regulatory uncertainty for so long, this is a huge step toward clarity, removing a huge obstacle for institutional and exchange-level adoption.
Later that day, the House also passed the Digital Asset Market CLARITY Act in a 294–134 vote, bringing clarity to whether crypto tokens fall under SEC or CFTC jurisdiction. Given that XRP has had its fair share of classification challenges in the past, particularly with the SEC, this kind of clarity is a game-changer that can unlock more on‑chain liquidity and infrastructure support within regulated channels.
With "Crypto Week" in full swing and steadfast support from President Trump, who has applauded the development, the confluence of stablecoin regulation, market structure guidance, and political determination offers stout tailwinds behind XRP's breakout. What was uncertainty is rapidly turning into opportunity, and XRP is well-positioned to take advantage.
Start trading with PrimeXBT
Author

PrimeXBT Research Team
PrimeXBT
PrimeXBT is a leading Crypto and CFD broker that offers an all-in-one trading platform to buy, sell and store Cryptocurrencies and trade over 100 popular markets, including Crypto Futures, Copy Trading and CFDs on Crypto, Forex, I