XLM Price Prediction: Stellar reversion to the mean complete with a 20% drop
- XLM price trading quietly below the May 23 low, lacking the impulsiveness to catapult it higher.
- Daily Relative Strength Index (RSI) has logged an oversold reading, providing the basis for a firm low to form.
- A test of the 200-week SMA (mean) is a contingency if broader cryptocurrency weakness accelerates once again.

XLM price closed June 22 with a doji candlestick pattern followed by two days of upward price traction, both lacking the volume and impulsiveness to fracture the resistance of the May 23 low. As long as Stellar remains below the May 23 low, it is dead money with the potential to test the mean.
XLM price seeks commitment, but rebound attempt quickly fades
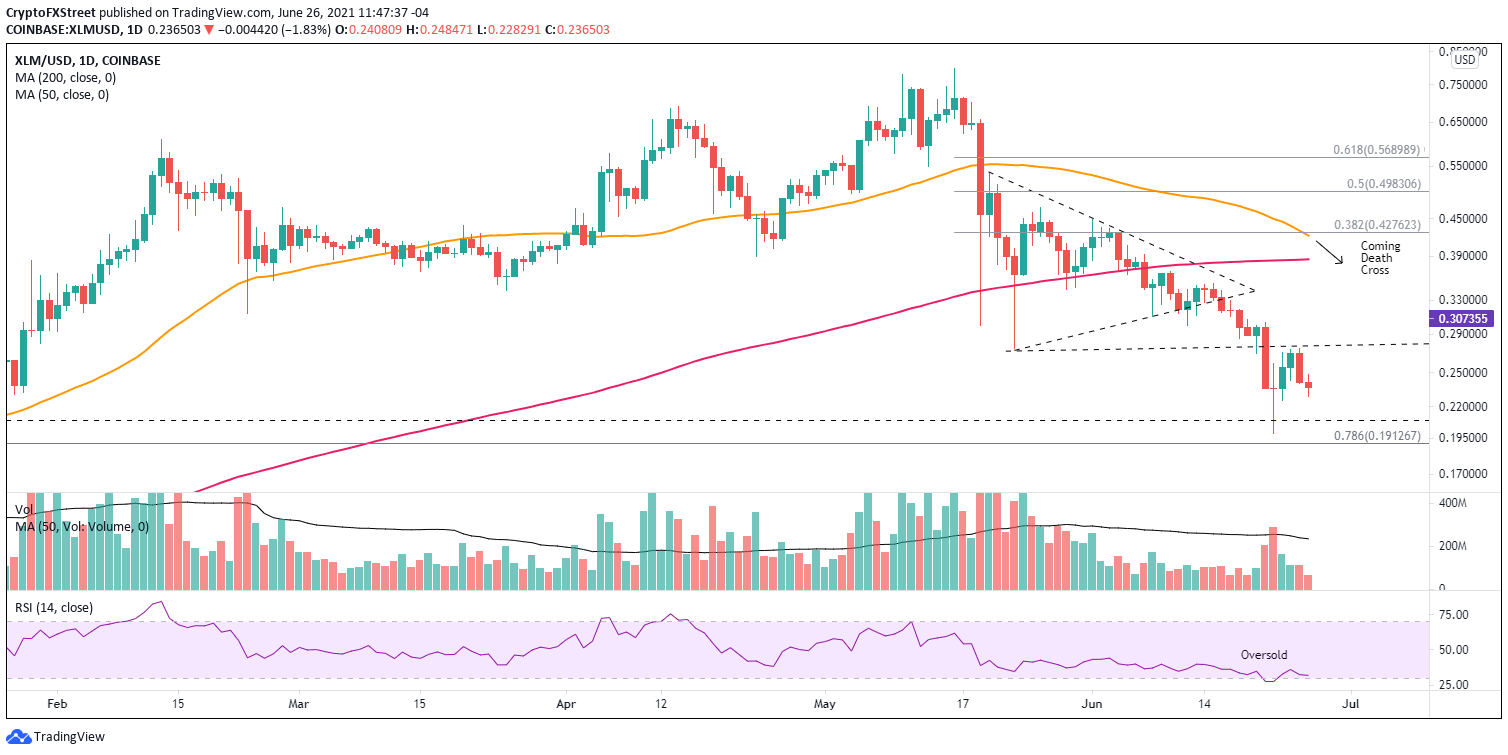
XLM price plunged 75% from the May 16 high of $.0797 to the June 22 low of $0.198, and a staggering 40% from the June 16 breakdown from a symmetrical triangle pattern. The drop included an easy break of the May 23 low at $0.274 and nearly pressed Stellar against the 78.6% Fibonacci retracement of the Marcy 2020-2021 advance at $0.191 while logging the first oversold reading on the daily RSI since September 2020.
The slide in XLM price was not a complete surprise. In an FXStreet post on June 15, it was projected that Stellar would be one of the first altcoins to sweep the May lows, and it was.
The XLM price action since the June 22 low highlighted by the doji candlestick has not demonstrated a new sign of commitment from Stellar speculators; instead, it has taken the form of a dead-cat bounce as the price has modestly rebounded on lighter volume.
Unless XLM price regains the May 23 low on a daily closing basis, Stellar is vulnerable to further weakness, maybe to the 78.6% retracement at $0.191 or even the 200-week simple moving average at $0.178. A decline to the moving average would signal a complete reversion to the mean and an additional 23% loss from the current price.
The oversold condition on the daily RSI may contain XLM price and keep any further weakness above the retracement. Nevertheless, the worst-case scenario for Stellar is a test of the mean at $0.178.
XLM/USD daily chart
A daily close above the May 23 low immediately improves the Stellar outlook, opening the opportunity to entertain pilot buys with a higher probability of success. A successful breakout would generate a 20% gain by the symmetrical triangle’s apex at $0.340 and a 40% gain at the strategically important 200-day SMA. XLM price could even extend the rally to the current intersection of the 50-day SMA at $0.421 with the 38.2% retracement of the May-June decline at $0.427.
If Stellar market operators are impatient for a daily close above the May 23 low, they can use a pullback to the near union of the May 22 low with the 78.6% retracement as a pilot buy opportunity.
One caveat to mention is that Stellar will trigger a bearish Death Cross pattern over the next few days, adding downward pressure on the developing price structure.
After all the volatility, Stellar is now the 19th largest cryptocurrency with a market capitalization of $5.44 billion, sandwiched between Wrapped Bitcoin and Dai.
Of course, bottoms in the cryptocurrency markets are sometimes only a tweet away, so being alert to the precise Stellar support and resistance levels highlighted above will be the optimal approach to capitalize on emerging price structure clarity and trading opportunities.
Author

Sheldon McIntyre, CMT
Independent Analyst
Sheldon has 24 years of investment experience holding various positions in companies based in the United States and Chile. His core competencies include BRIC and G-10 equity markets, swing and position trading and technical analysis.



