XLM Price Prediction: Stellar gets ready for 125% upsurge to record highs


  • Stellar has settled above former crucial resistance at $0.465, currently the immediate support.
  • Closing the day above the key levels will set XLM on a trajectory to all-time highs.
  • The RSI's negative divergence suggests that a correction could be in the cards.

Stellar appears to have cooled off the rally after breaking above the crucial April 2018 hurdle at $0.465. A multi-year high has recently been established at $0.61, but bulls lost steam. The bulls aim to hold above the resistance turned support at $0.465 and plan for another attack mission to the record highs of $1.05.

Stellar is only 125% to the all-time high

The progress XLM has made in the ongoing bull run is tremendous, making the remaining journey to $1.05 a near-term goal. The cross-border token is dancing at $0.5 amid the push by the bulls to secure higher support.

The Moving Average Convergence Divergence (MACD), a trend direction indicator, shows that Stellar is generally moving upward despite the current snarl-up. This technical indicator is used to correctly identify positions where traders can enter or exit the market. Currently, the wide divergence made by the MACD line (blue) above the signal line hints at the bullish outlook remaining intact.

XLM/USD price chart

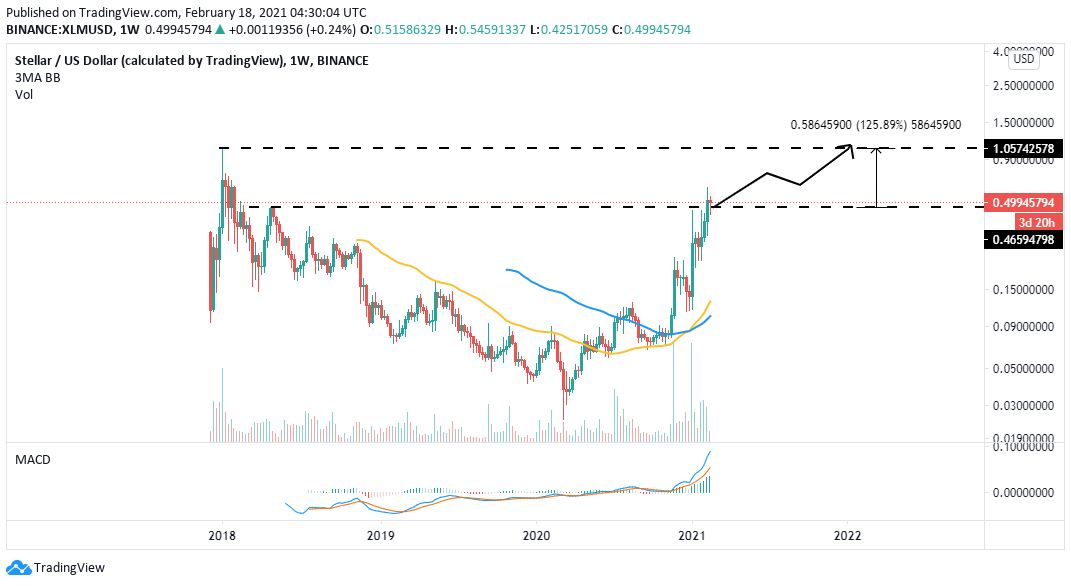
XLM/USD weekly chart

The Parabolic SAR points confirm buyers are in control. This indicator shows that the trend is bullish when the parabolas (dots) are below the price. Moreover, closing the day above $0.5 will add credence to the bullish momentum and perhaps call out more buyers to join the market.
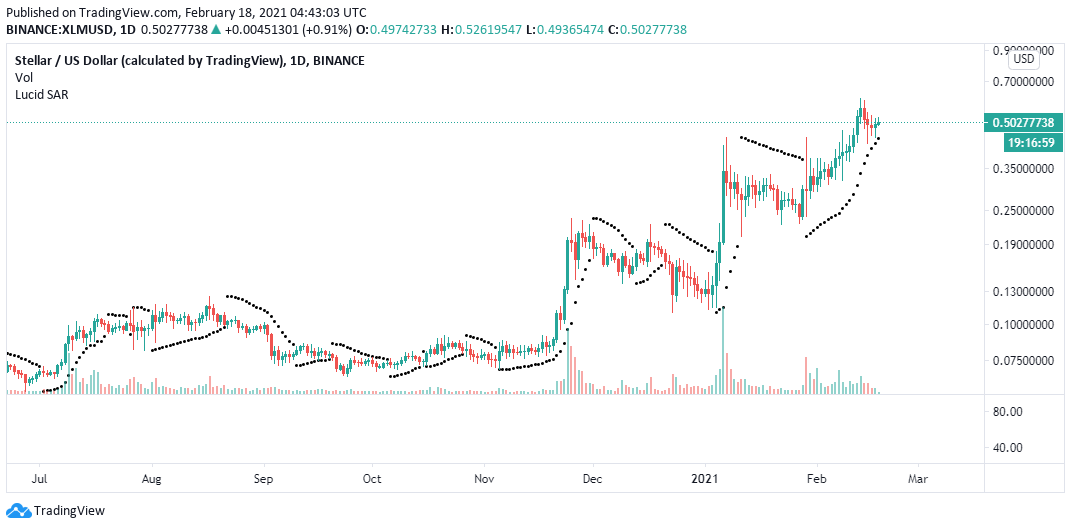
Crypto!FXS247

XLM/USD daily chart

Looking at the other side of the fence

The Relative Strength Index (RSI) has a negative divergence on the 4-hour chart. A bearish divergence occurs when an asset's price is generally trending upwards while the RSSI moves downwards.

XLM/USD price chart

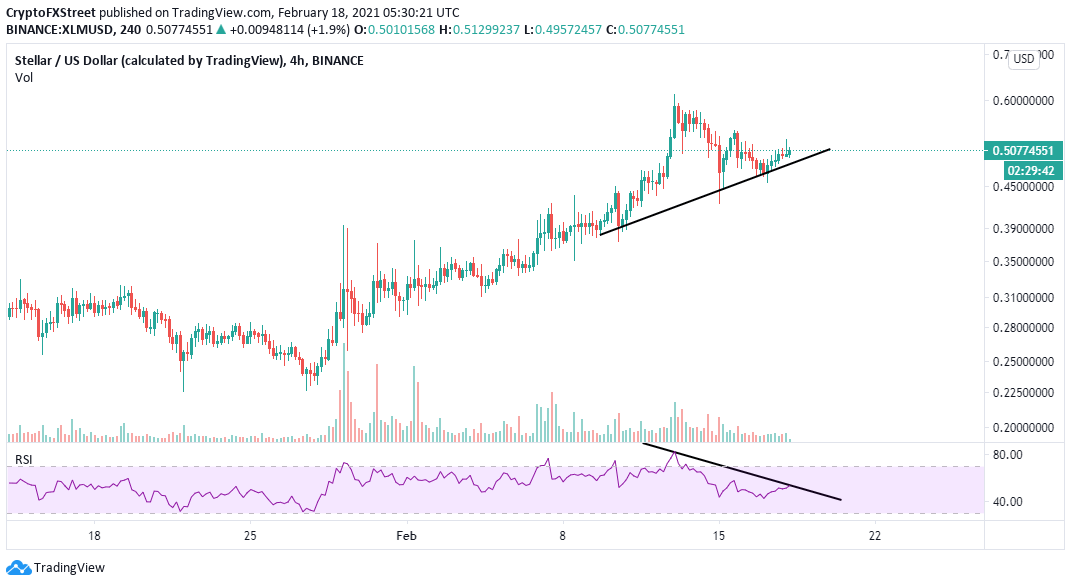
XLM/USD 4-hour chart

The negative divergence could mean that Stellar is nearing a tipping point, and correction will come into play. The trend reversal will be confirmed when the price breaks below the trendline or crucial support such as $0.5 and $0.465.


Information on these pages contains forward-looking statements that involve risks and uncertainties. Markets and instruments profiled on this page are for informational purposes only and should not in any way come across as a recommendation to buy or sell in these assets. You should do your own thorough research before making any investment decisions. FXStreet does not in any way guarantee that this information is free from mistakes, errors, or material misstatements. It also does not guarantee that this information is of a timely nature. Investing in Open Markets involves a great deal of risk, including the loss of all or a portion of your investment, as well as emotional distress. All risks, losses and costs associated with investing, including total loss of principal, are your responsibility. The views and opinions expressed in this article are those of the authors and do not necessarily reflect the official policy or position of FXStreet nor its advertisers. The author will not be held responsible for information that is found at the end of links posted on this page.

If not otherwise explicitly mentioned in the body of the article, at the time of writing, the author has no position in any stock mentioned in this article and no business relationship with any company mentioned. The author has not received compensation for writing this article, other than from FXStreet.

FXStreet and the author do not provide personalized recommendations. The author makes no representations as to the accuracy, completeness, or suitability of this information. FXStreet and the author will not be liable for any errors, omissions or any losses, injuries or damages arising from this information and its display or use. Errors and omissions excepted.

The author and FXStreet are not registered investment advisors and nothing in this article is intended to be investment advice.

Join Telegram

Recommended content


Recommended Content

Editors’ Picks

MANTA suffers 4% pullback after unlocking tokens worth $40 million

MANTA suffers 4% pullback after unlocking tokens worth $40 million

Manta Network (MANTA) unlocked over 8% of its circulating supply on Thursday. The unlocked tokens were airdropped and distributed in public sale, according to data from Tokenunlocks. 

More Cryptocurrencies News

XRP struggles to recover as lingering Ripple lawsuit could reach Supreme Court, former SEC litigator says

XRP struggles to recover as lingering Ripple lawsuit could reach Supreme Court, former SEC litigator says

The SEC vs. Ripple potential showdown at the Supreme Court is likely, says former SEC litigator Ladan Stewart. XRP Ledger calls developers, businesses and investors to build on the blockchain, extending Apex 2024 registration until April 30. 

More Ripple News

Bitcoin Layer 2 Merlin chain TVL climbs 20%, defying broad market correction

Bitcoin Layer 2 Merlin chain TVL climbs 20%, defying broad market correction

Merlin chain’s TVL added 20% this week, and crossed $800 million on Thursday. Bitcoin Layer 2 assets noted double-digit losses in the past week. Stacks, Elastos, SatoshiVM, BVM are hit by a correction as Bitcoin hovers around $61,000. 

More Bitcoin News

If Bitcoin restarts bull run, these altcoins are likely to explode Premium

If Bitcoin restarts bull run, these altcoins are likely to explode

If Bitcoin’s consolidation ends and the bull run resumes, altcoins are likely going to trigger a massive rally. Last cycle’s hot tokens like SOL, AVAX, WIF, ONDO, etc., could see renewed enthusiasm. 

More Cryptocurrencies News

Bitcoin: BTC’s rangebound movement leaves traders confused

Bitcoin: BTC’s rangebound movement leaves traders confused

Bitcoin (BTC) price has been hovering around the $70,000 psychological level for a few weeks, resulting in a rangebound movement. This development could lead to a massive liquidation on either side before a directional move is established. 

Read full analysis

BTC

ETH

XRP