XLM Price Forecast: Stellar 400% upswing stalls risking breakdown to $0.41
- Stellar is on the verge of a potential breakdown to $0.41 after rejection at $0.61.
- The TD Sequential indicator has flashed several sell signals, adding weight to the correction.
- XLM will resume the upswing to new yearly highs if buyers push above $0.61.

Stellar has been rejected from the yearly high at $0.61, opening the door for a potential correction. The cross border token has already incurred some losses, forcing it to retreat to price levels under $0.6. At the time of writing, XLM is teetering at $0.55 amid the bulls' persistent push to secure higher support and resume the uptrend.
Stellar could retreat to $0.41 support before resuming the uptrend
Following the rejection from $0.61, XLM's least resistance path is downwards and may lead to more declines if the uptrend fails to resume soon. The Relative Strength Index (RSI) on the 4-hour chart adds credibility to the potential breakdown after being purged from the overbought region.
From the current price level, the next formidable support target is the former resistance at $0.41. The 50 Simple Moving Average (SMA) on the 4-hour chart will also absorb the selling pressure, limiting the losses.
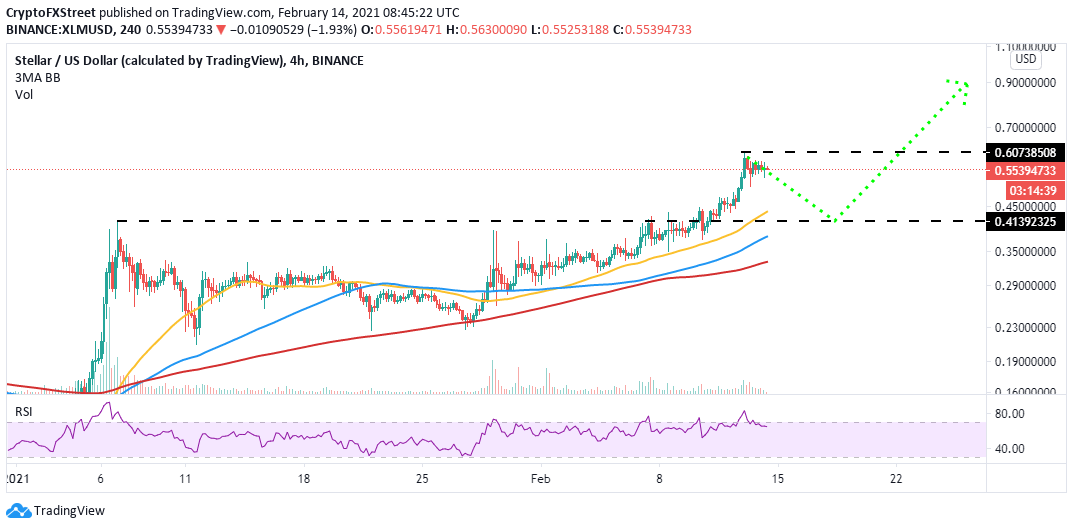
XLM/USD 4-hour chart
The TD Sequential indicator has presented a sell signal on the 12-hour and daily charts. The calls to sell manifested in green nine candlesticks. If validated, Stellar will continue with the breakdown targeting $0.41. The TD Sequential sell signals identify instances when an asset's uptrend is nearing exhaustion, thus favoring a potential correction.
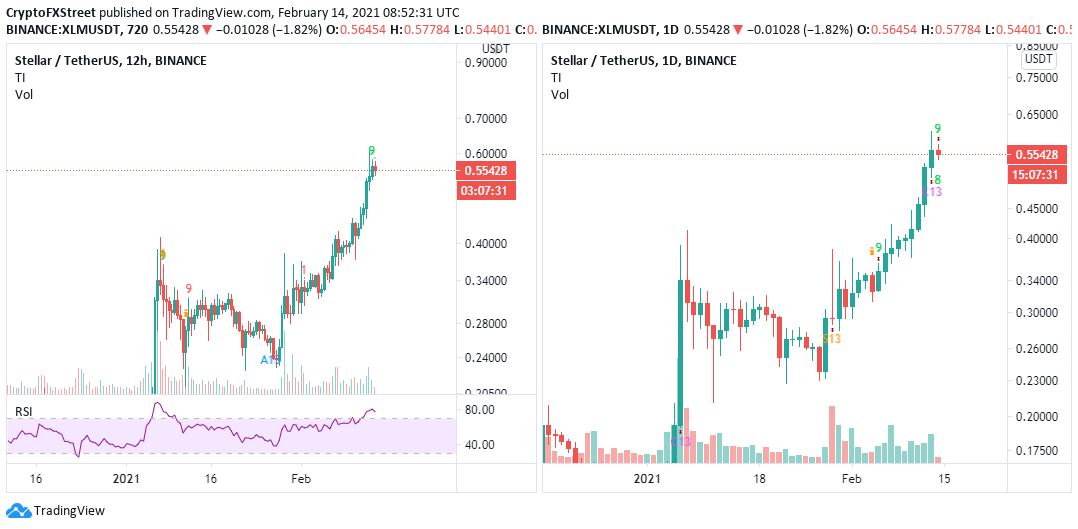
XLM/USD 12-hour/daily chart
Looking at the other side of the fence
It is worth mentioning that Stellar's rally will remain intact if the immediate resistance at $0.61 is broken. Trading above this zone will confirm to the investors that XLM is ready for another swing upwards. Support at $0.5 must also hold to ensure that losses do not extend to $0.41.
Author

John Isige
FXStreet
John Isige is a seasoned cryptocurrency journalist and markets analyst committed to delivering high-quality, actionable insights tailored to traders, investors, and crypto enthusiasts. He enjoys deep dives into emerging Web3 tren


