XLM Price Prediction: Stellar breaks out, targeting a 25% gain
- XLM price pattern follows a clear and definite uptrend before forming.
- Stellar serves to connect financial institutions for cross-border transfers.
- Need a close above $0.577 on the 12-hour chart to confirm new rally.

XLM price is trying to break out today from a bullish cup-with-handle pattern on a sizeable increase in volume. A close above $0.577 should ignite a rally to at least the measured move target of $0.720, thereby eclipsing the 461.8% Fibonacci extension of the 2019-2020 bear market.
XLM price needs an increase in institutional adoption
Stellar’s blockchain reduces or eliminates the complexity and delays associated with cross-border transfers inherent in the Nostro-Vostro process. The ecosystem’s valuable functionality has yet to be completely felt in the XLM price, partly because it doesn’t command the substantial and sustained institutional support as other cryptocurrencies.
Platforms like Paypal and Square give their users the ability to buy and sell cryptocurrencies from their platform, but operations are primarily concentrated in Bitcoin. It raises the question of whether the institutional community will widely embrace Stellar Lumens outside of Grayscale, which has invested in the digital coin, buying over $6 mln XLM.
On the largest 12-hour volume since February 23, XLM is attempting to begin a new rally into all-time highs. The clear, irrefutable resistance is the convergence of the 78.6% retracement of the February decline at $0.545 and the 361.8% extension of the 2019-2020 bear market at $0.546. A daily close above will release the cryptocurrency to test the all-time high at $0.608.
The measured move target is $0.720, a gain of 25% from the cup-with-handle breakout. It sits just below the 138.2% extension of the February decline at $0.721.
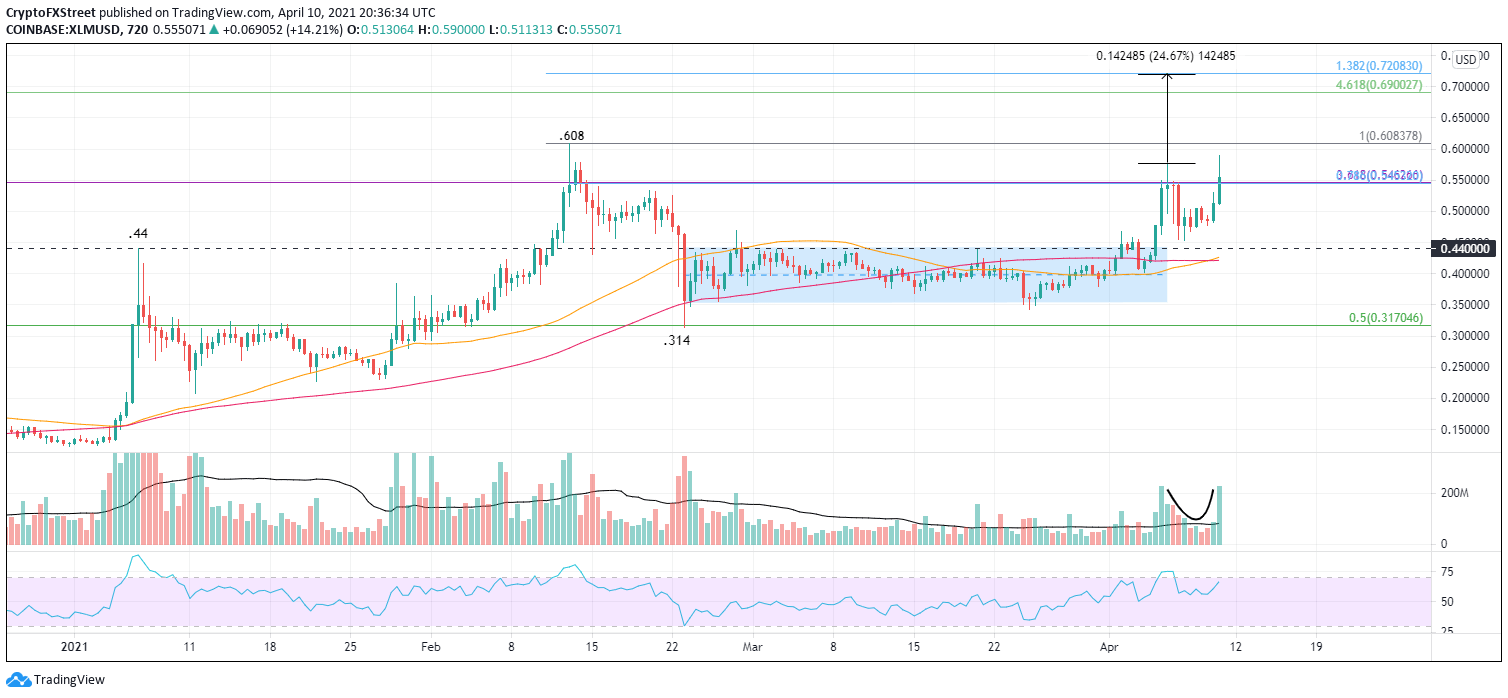
XLM/USD 12-hour chart
A rejection of the breakout could lead to a sharp reversion back to the January high at $0.440, a level that was resistance in March and earlier this month. The next level of support is the confluence of the 50 twelve-hour simple moving average (SMA) at $0.421with the 100 twelve-hour SMA at $0.426.
A total collapse would target another confluence of support, the 50% retracement of the 2020-2021 rally at $0.317 with the February low at $0.314.
Author

Sheldon McIntyre, CMT
Independent Analyst
Sheldon has 24 years of investment experience holding various positions in companies based in the United States and Chile. His core competencies include BRIC and G-10 equity markets, swing and position trading and technical analysis.



