XLM Price Projection: Stellar rally may extend another 34%
- XLM price closed yesterday with the largest one-day gain since January 6.
- Stellar group on Reddit speculate that a CBDC could be set up on the blockchain.
- Fibonacci levels collide, creating significant short-term resistance.

XLM price closed the week beginning March 22 with a hammer pattern, setting the backdrop for a surge in price. Stellar climbed almost 8% the following week, and it is up 25% this week at the time of writing. Today, momentum has stalled just above the convergence of the 3.618 Fibonacci extension of the 2019-2020 bear market at $0.546 and the 0.786 retracement level of the February crash at $0.545.
XLM price at an inflection point
For all of March, Stellar traded in a parallel channel on low volume and modest daily price movements. It was a classic case of price compression that will lead to price expansion and, in this case, to the upside.
Stellar is at a technical inflection point. It may take several days of consolidation before the remittance token can rally through the price resistance defined by the 0.786 retracement level, the 3.618 extension level, and the all-time high at $0.608.
If the resistance is overcome, look to the 4.618 extension level of the 2019-2020 bear market at $0.690, followed closely by the 1.382 extension level of the February crash at $0.720, representing a gain of 34% from yesterday’s close. An optimistic profit target is the 1.618 extension level of the February crash at $0.790.
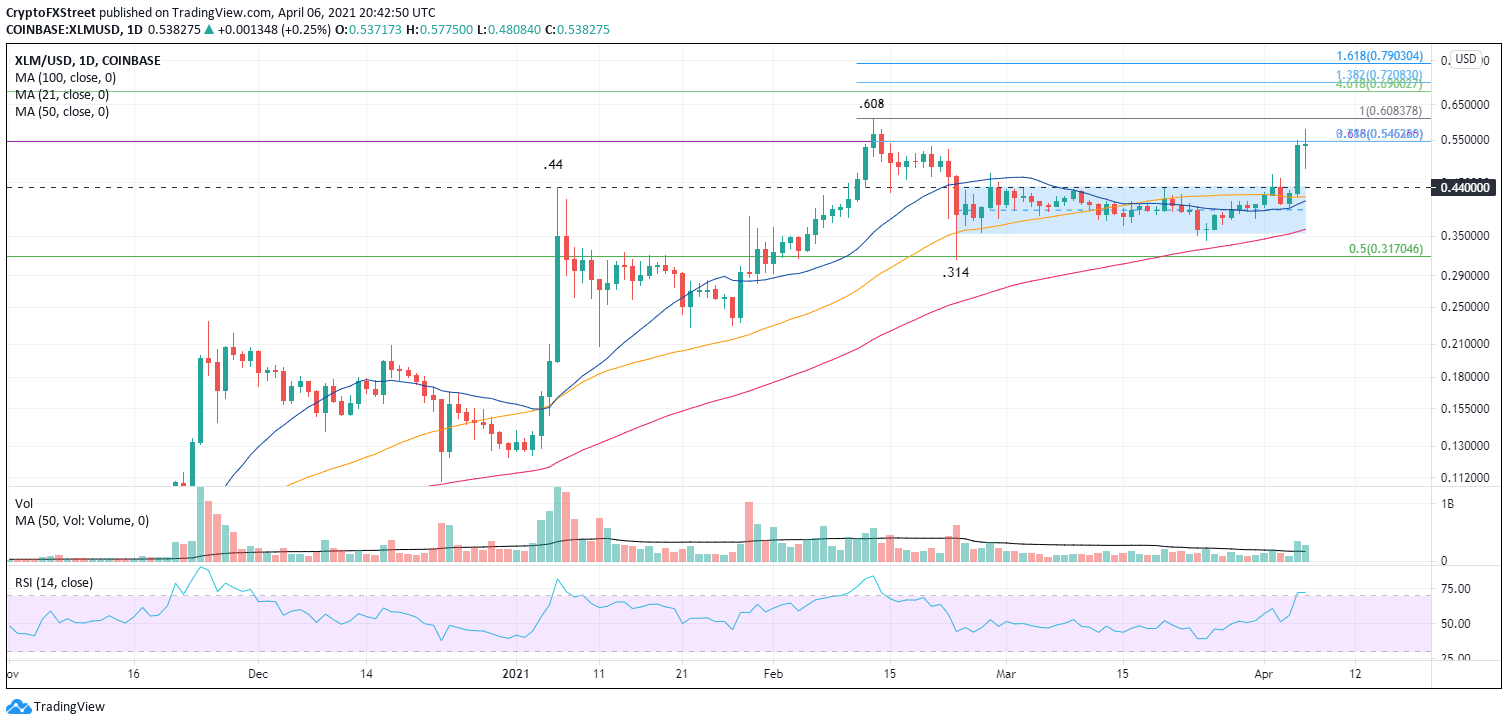
XLM/USD daily chart
No market forecast is a 100% probability. Thus, Stellar may reverse from the major resistance. Critical support is at the intersection of the channel highs with the January high around $0.440.
A second layer of support comes at the intersection of the channel lows with the 100-day simple moving average (SMA) around $0.360. A collapse below the channel will put the February lows’ confluence at $0.314 with the 0.50% retracement level of the 2020-2021 bull market at $0.317 in the crosshairs.
Author

Sheldon McIntyre, CMT
Independent Analyst
Sheldon has 24 years of investment experience holding various positions in companies based in the United States and Chile. His core competencies include BRIC and G-10 equity markets, swing and position trading and technical analysis.


