XLM price breakout imminent as Stellar’s technicals show strength
- XLM price coiling for an explosive move higher.
- The three-week Ichimoku chart gives an apparent reason why XLM has had difficulty moving higher.
- A successful move above resistance could see XLM outperform nearly the entire altcoin market.

XLM price has been in a rut over the past nine weeks. Most frustrating for bulls has been the inability for XLM to reach the $0.50 level. However, that is about to change.
XLM price is positioned for one of the most extensive breakouts in the altcoin market
XLM price has struggled. That struggle is seen on the three-week Ichimoku chart. For any XLM bull, trader or investor, the three-week Ichimoku chart can be summed up in one word: ugly. One look at that chart clearly explains why XLM has struggled to make any significant move higher. Consider the following three-week Ichimoku levels, the 2021 Volume Profile, and their respective price values:
- 2021 Volume Point Of Control: $0.40
- Three-week Kijun-Sen: $0.43
- Three-week Senkou Span B: $0.46
- Three-week Tenkan-Sen: $0.50
The positive development for XLM price is the threshold it needs to meet to confirm an Ideal Bullish Ichimoku Breakout is easier given how close the Tenkan-Sen, Kijun-Sen and Senkou Span B are to each other. A close at or above $0.50 would fulfill all requirements for a bullish entry. Aggressive traders may even look at a close above Senkou Span B but below the Tenkan-Sen at $0.46.
Utilizing Fibonacci expansions, implied profit target zones can be forecasted. After a confirmed bullish close, the first profit target zone is the 100% Fibonacci expansion at $0.97. Next is the 161.8% Fibonacci expansion at $1.45. A move to $1.45 would create a new all-time high for XLM price – something it hasn’t done in almost four years.
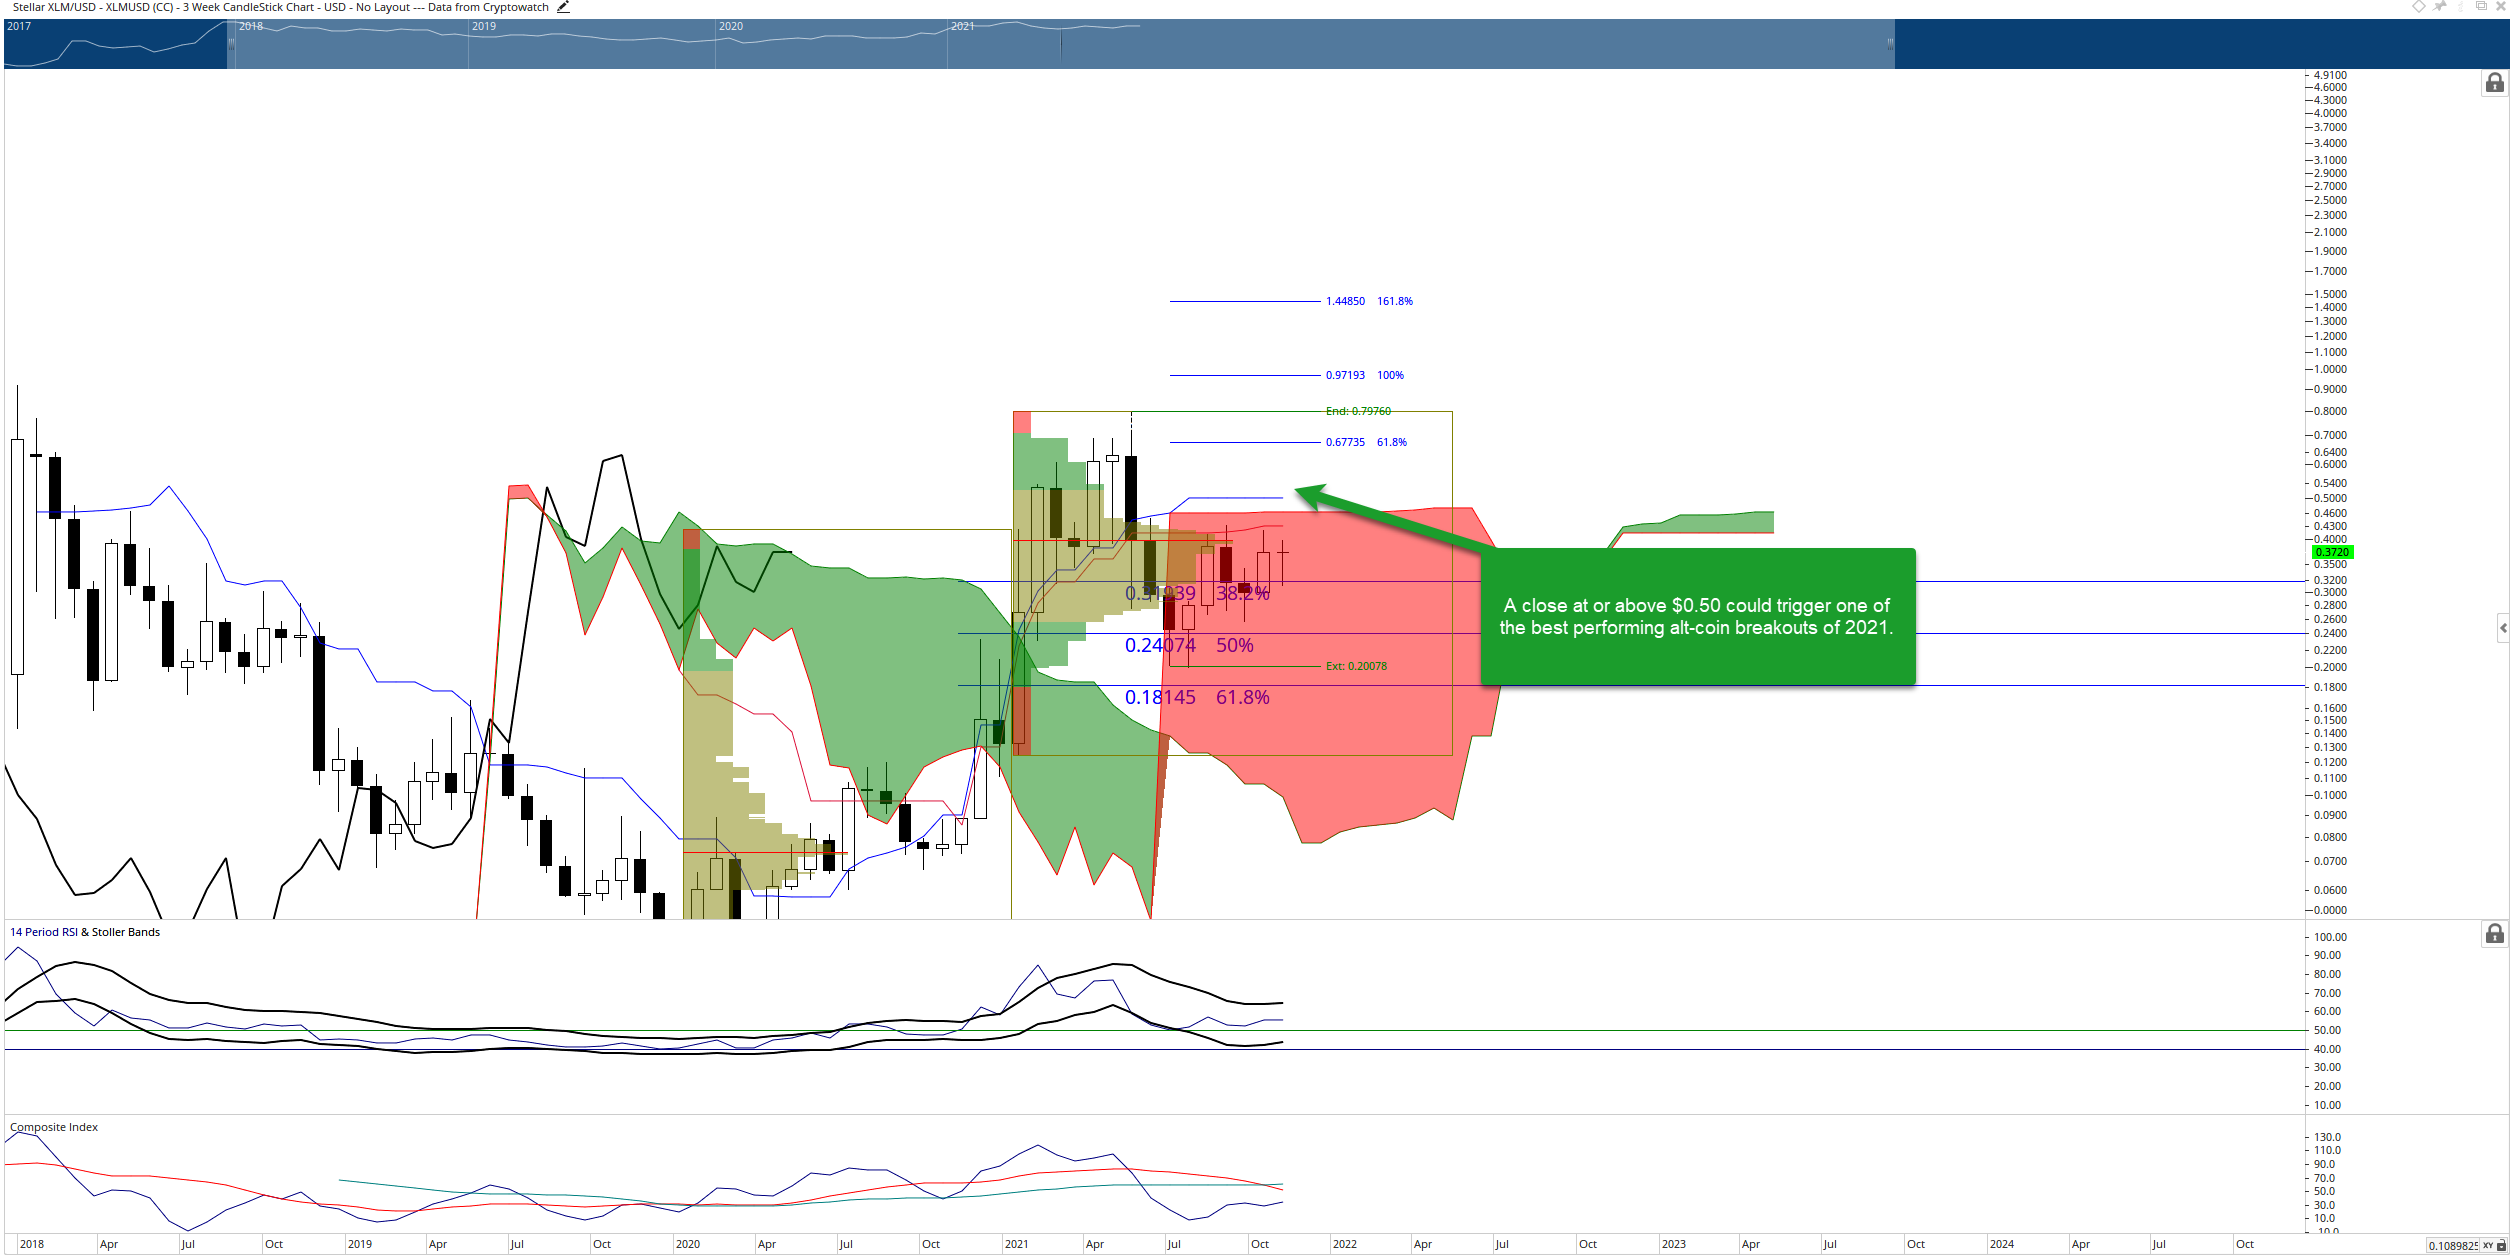
XLM/USD 3-week Ichimoku Chart
The bullish outlook could take some time to develop, even in an atmosphere where Bitcoin, Ethereum and other altcoins experience big moves to new highs. This has been the case for XLM price for most of 2020 and 2021. As a result, any close below the $0.25 level for XLM would likely end any further upside potential and cause many traders to abandon it permanently.
Author

Jonathan Morgan
Independent Analyst
Jonathan has been working as an Independent future, forex, and cryptocurrency trader and analyst for 8 years. He also has been writing for the past 5 years.


