XLM buyers frustrated as Stellar fizzles out
- XLM price faces another rejection against the $0.41 value area.
- Despite multiple bullish attempts to break out above $0.41, sellers slap XLM lower.
- Hidden bullish development on the Point and Figure chart may destroy short sellers.

XLM price has been a frustrating instrument for any long-term investor or short-term speculator. It’s hard to believe and even harder to remember, but XLM has not made a new all-time high since 2018! Psychologically, bulls have been trolled throughout October – but the joke may soon be on the bears.
XLM price action may play a trick on the bears this Halloween, bringing treats for the bulls
XLM price may trick any bears that believe XLM is ready for another bearish breakdown lower. While the candlestick chart and Ichimoku system show continued rejection higher, the $0.01/3-box Reversal Point and Figure chart shows a sort of hidden bullish setup that isn’t seen on a candlestick chart.
The red diagonal line on the Point and Figure chart below is the previous bear market trendline. Quick note: In Point and Figure charts and analysis, an instrument is always in a bull market or bear market. That bear market trendline was broken when the most recent X-column broke above it at $0.41. However, bears then took over and pushed XLM lower to create a double bottom and then a sell entry one box below at $0.32 – but that’s where XLM price stopped.
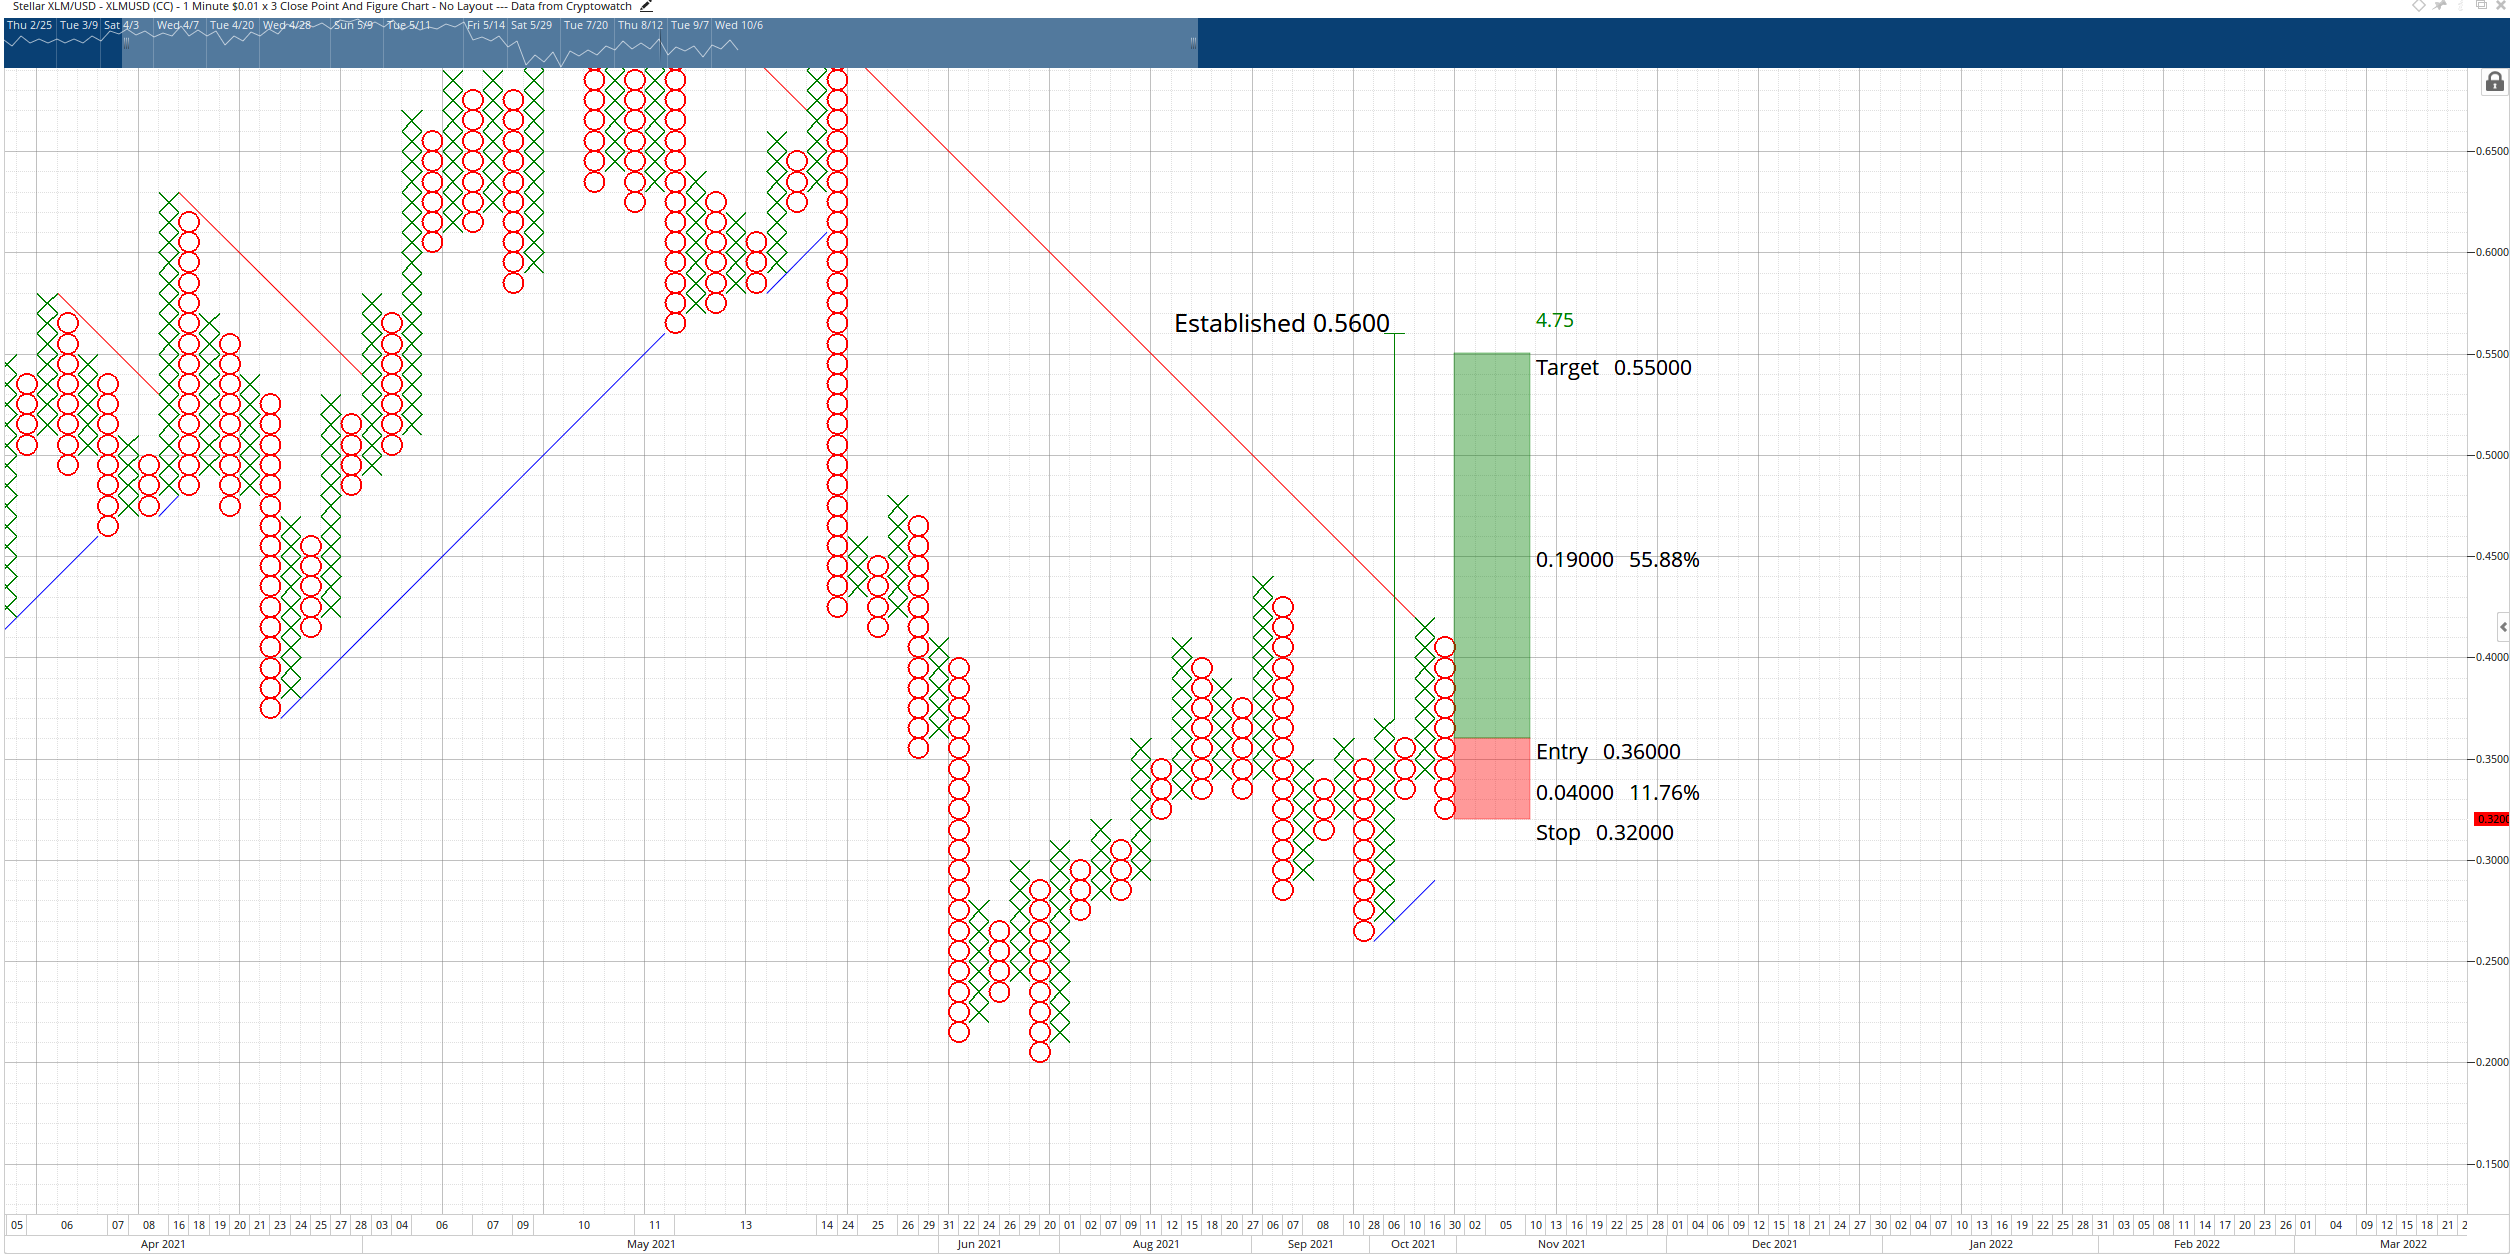
XLM/USD $0.01/3-box Reversal Point and Figure Chart
Because XLM price broke the bear trend angle, the market has converted into a bull market. The hypothetical long trade setup is a buy stop at the 3-box reversal ($0.36 at the time of publishing) with a 4-box stop loss and an optional 3-box trailing stop. The projected profit target from that entry is $0.55.
The current long setup can only be invalidated if a new low below $0.20 develops in the current O-column.
Author

Jonathan Morgan
Independent Analyst
Jonathan has been working as an Independent future, forex, and cryptocurrency trader and analyst for 8 years. He also has been writing for the past 5 years.


