Why LUNA price is set to drop minimally at first but holds big risks of implosion
- Terra price action erased the negative elements from last week and eked out gains on Saturday.
- LUNA price took a turn for the worse on Monday, dropping 5% between the High and Low of the day.
- As markets take another step back, expect to see LUNA price drop towards $0.000115, at risk of breaking vital support

Terra (LUNA) price action is under pressure again after it rallied against all odds following the development of a technically bearish indicator and pattern last week. The reality kicked in over the weekend on Sunday and Monday as the mighty greenback returned stronger and negatively impacted Terra’s valuation equation. Expect to see a brush against pivotal support and as dollar bulls potentially crack down on LUNA bulls.
LUNA bulls are facing headwinds from dollar bulls
Terra price action has surprised friends and foes with its rally since the end of last week as LUNA price action rose against all odds and despite warning lights pointing to a bearish outcome. With a bit of a delay, reality looks to be kicking in as LUNA price action takes another step back after the sharp drop on Monday, with global markets on the backfoot this week. In the European session, LUNA is undergoing a squeeze with a flat bottom and a lower high, indicating a break to the downside anytime soon.
LUNA price is not only facing the headwinds from global markets but additionally, the stronger dollar that has been rallying since the end of last week as investors take the warnings from several Fed members seriously that the Fed will keep hiking at a ferocious pace, meaning that any risk on will be short-lived for another few months. This also puts pressure on LUNA price, which is very much correlated to the dollar as a peg, which is very expensive to maintain and brings back memories of a few months ago when LUNA almost imploded on the initial dollar rally of 2022. Expect to see support around $0.000115, but keep an eye on that level because once that green ascending trend line breaks, a falling knife could be in the works with a pullback towards $0.000088 or a negative 25% return.
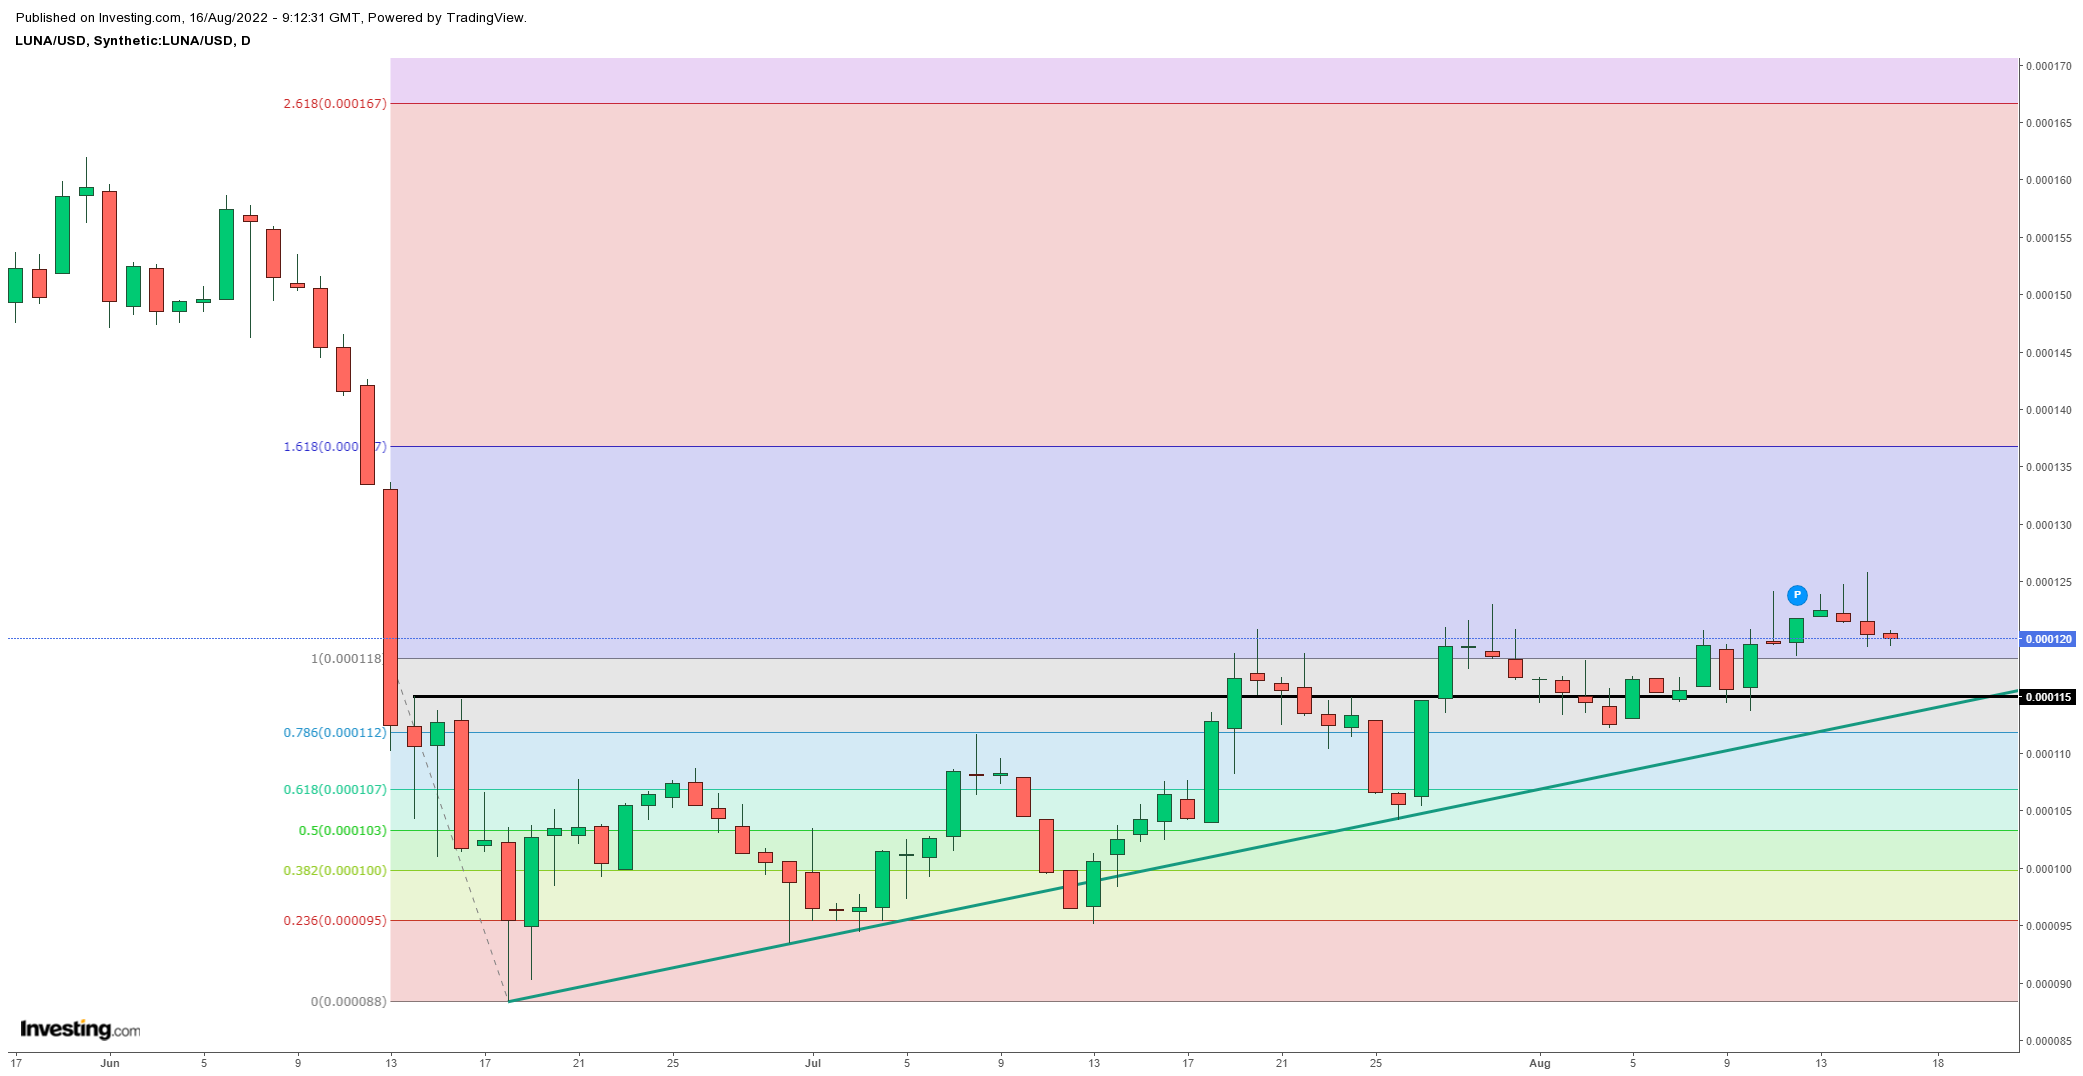
LUNA/USD Daily chart
A bounce off the support at $0.000115 is still possible as the small correction back to support would attract more investors and bulls, pushing price action back higher. Expect to see the rally jump back towards $0.000125 and try and make a new high for the week. From there, a jump of 10% should be possible, with the 61.8% Fibonacci level at $0.000137 a feasible target.
Author

Filip Lagaart
FXStreet
Filip Lagaart is a former sales/trader with over 15 years of financial markets expertise under its belt.



