Why is Solana (SOL) price down today?
The price of Solana's native token, SOL (SOL $172), has fallen by approximately 2% in the last 24 hours to reach $173.20. This drop is part of a correction that began two days ago, resulting in an overall decrease of approximately 8.25% thus far.
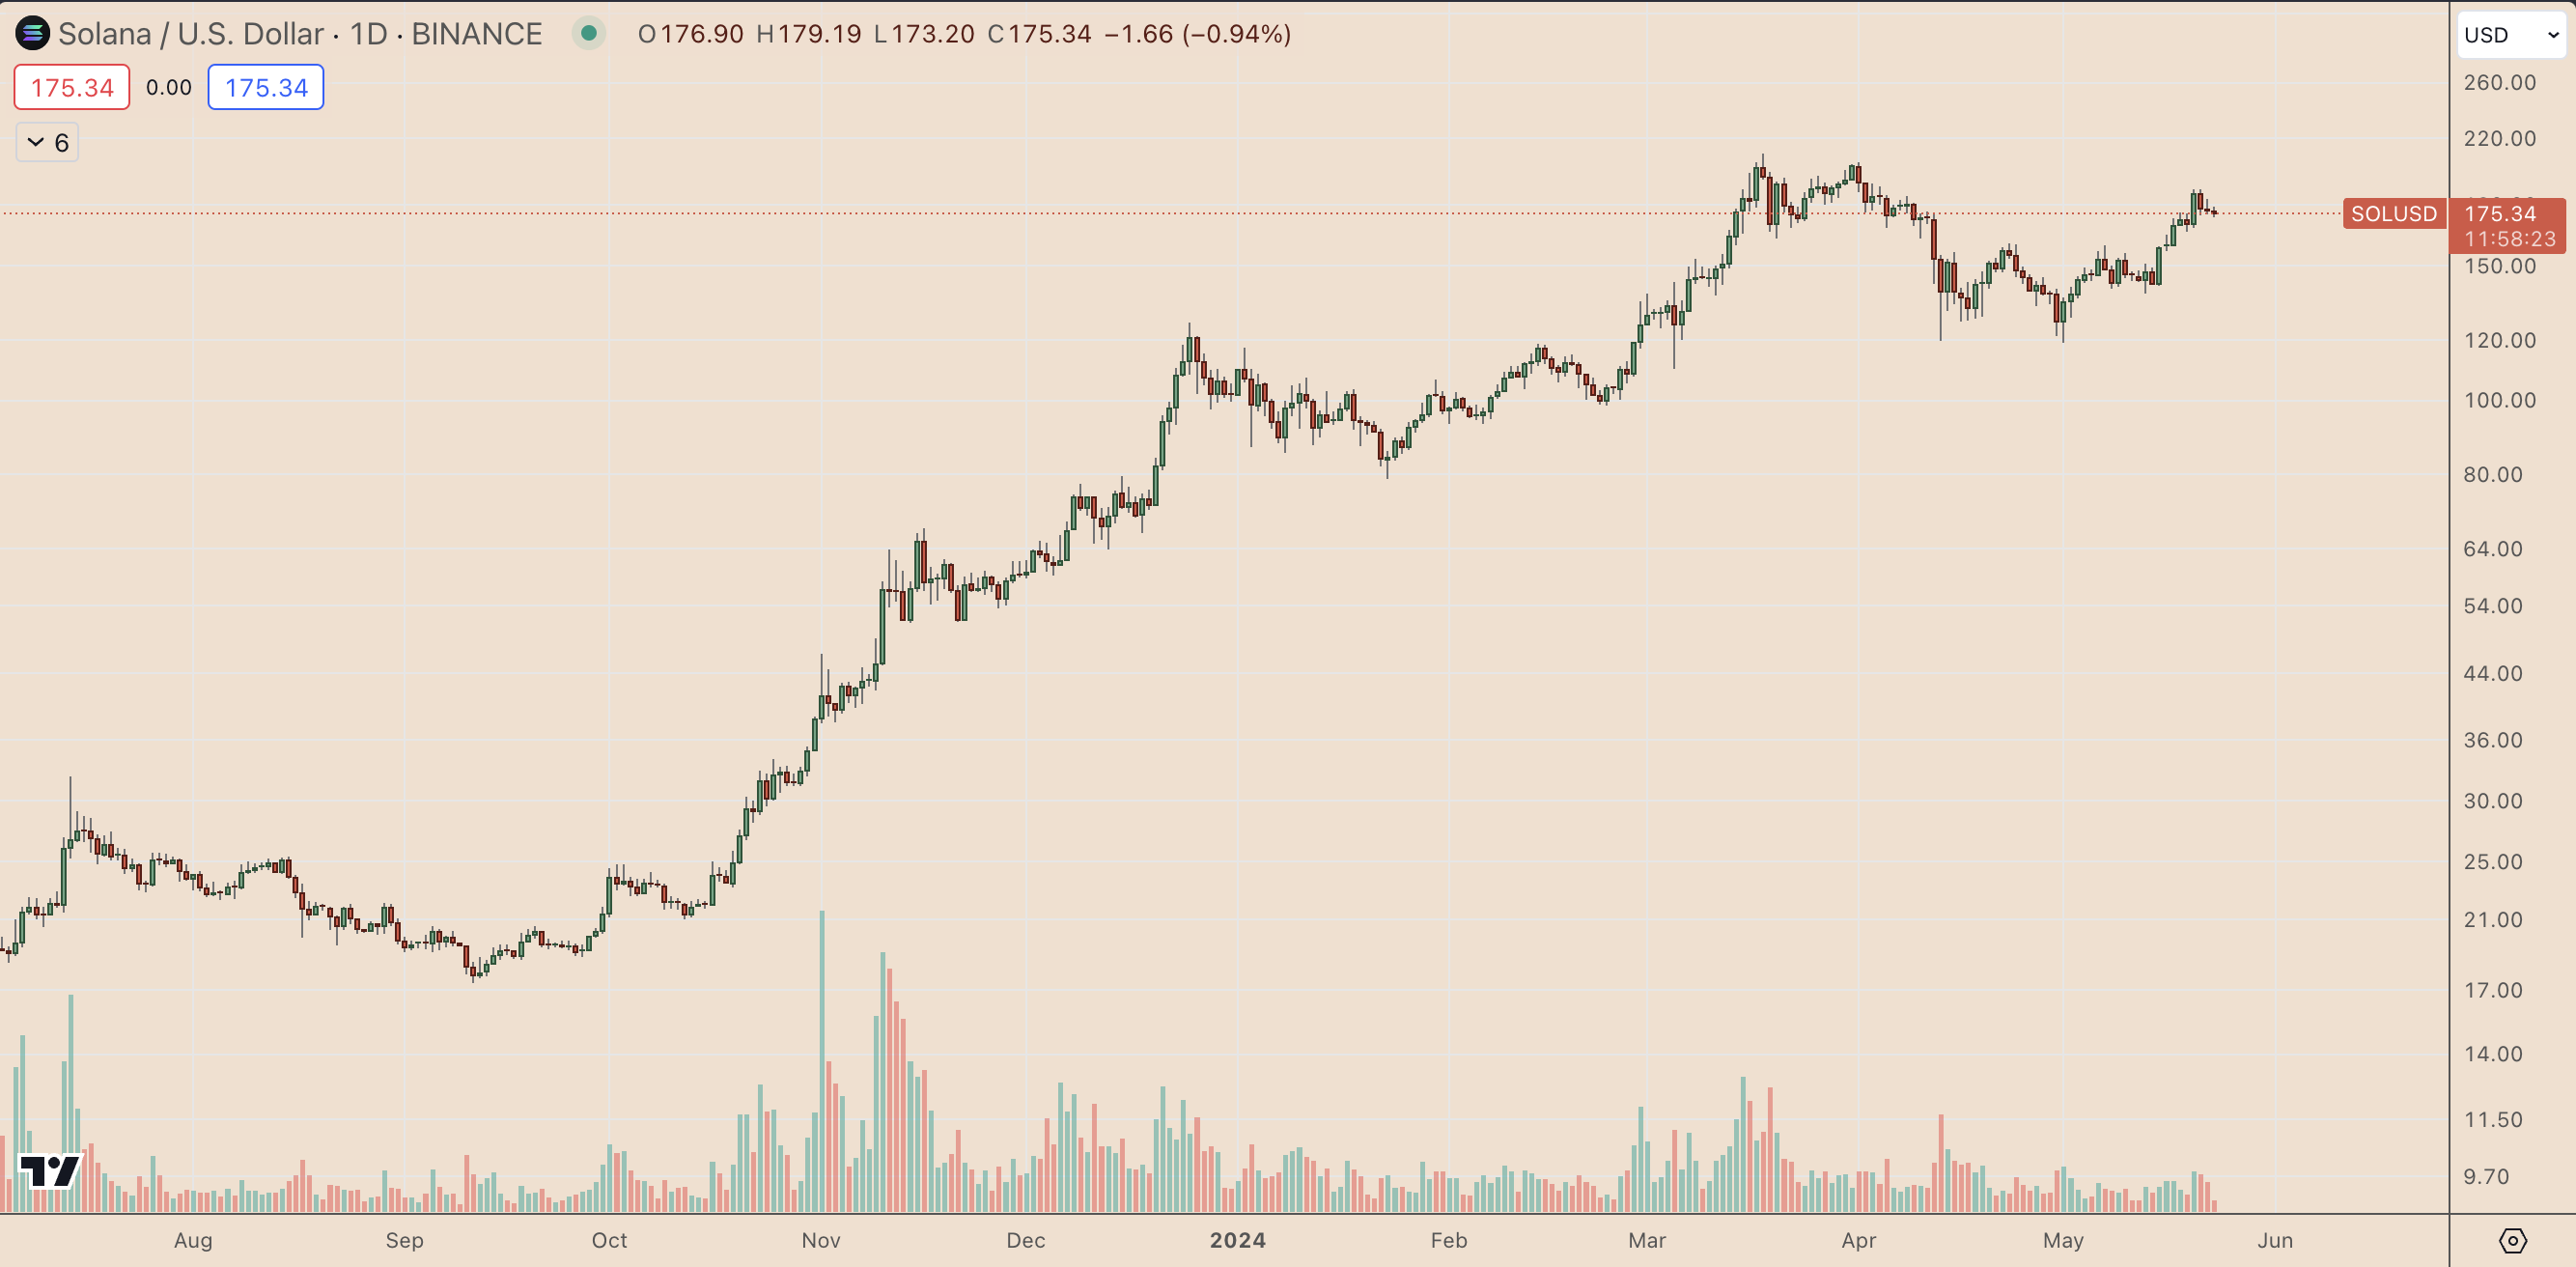
SOL/USD daily price chart. Source: TradingView
Top catalysts driving the SOL price lower these days include an outperforming layer-one blockchain rival, Ether (ETH $3,789), and increasing outflows from the Solana ecosystem.
Solana suffers as Ethereum steals the limelight
SOL's price started declining amid increasing odds of approval for spot Ether exchange-traded funds (ETFs) in the United States. For instance, the widely-tracked SOL/ETH pair has dropped 22.65% since May 20, when the U.S. Securities and Exchange Commission (SEC) contacted Ether ETF applicants to update their 19b-4 filings.
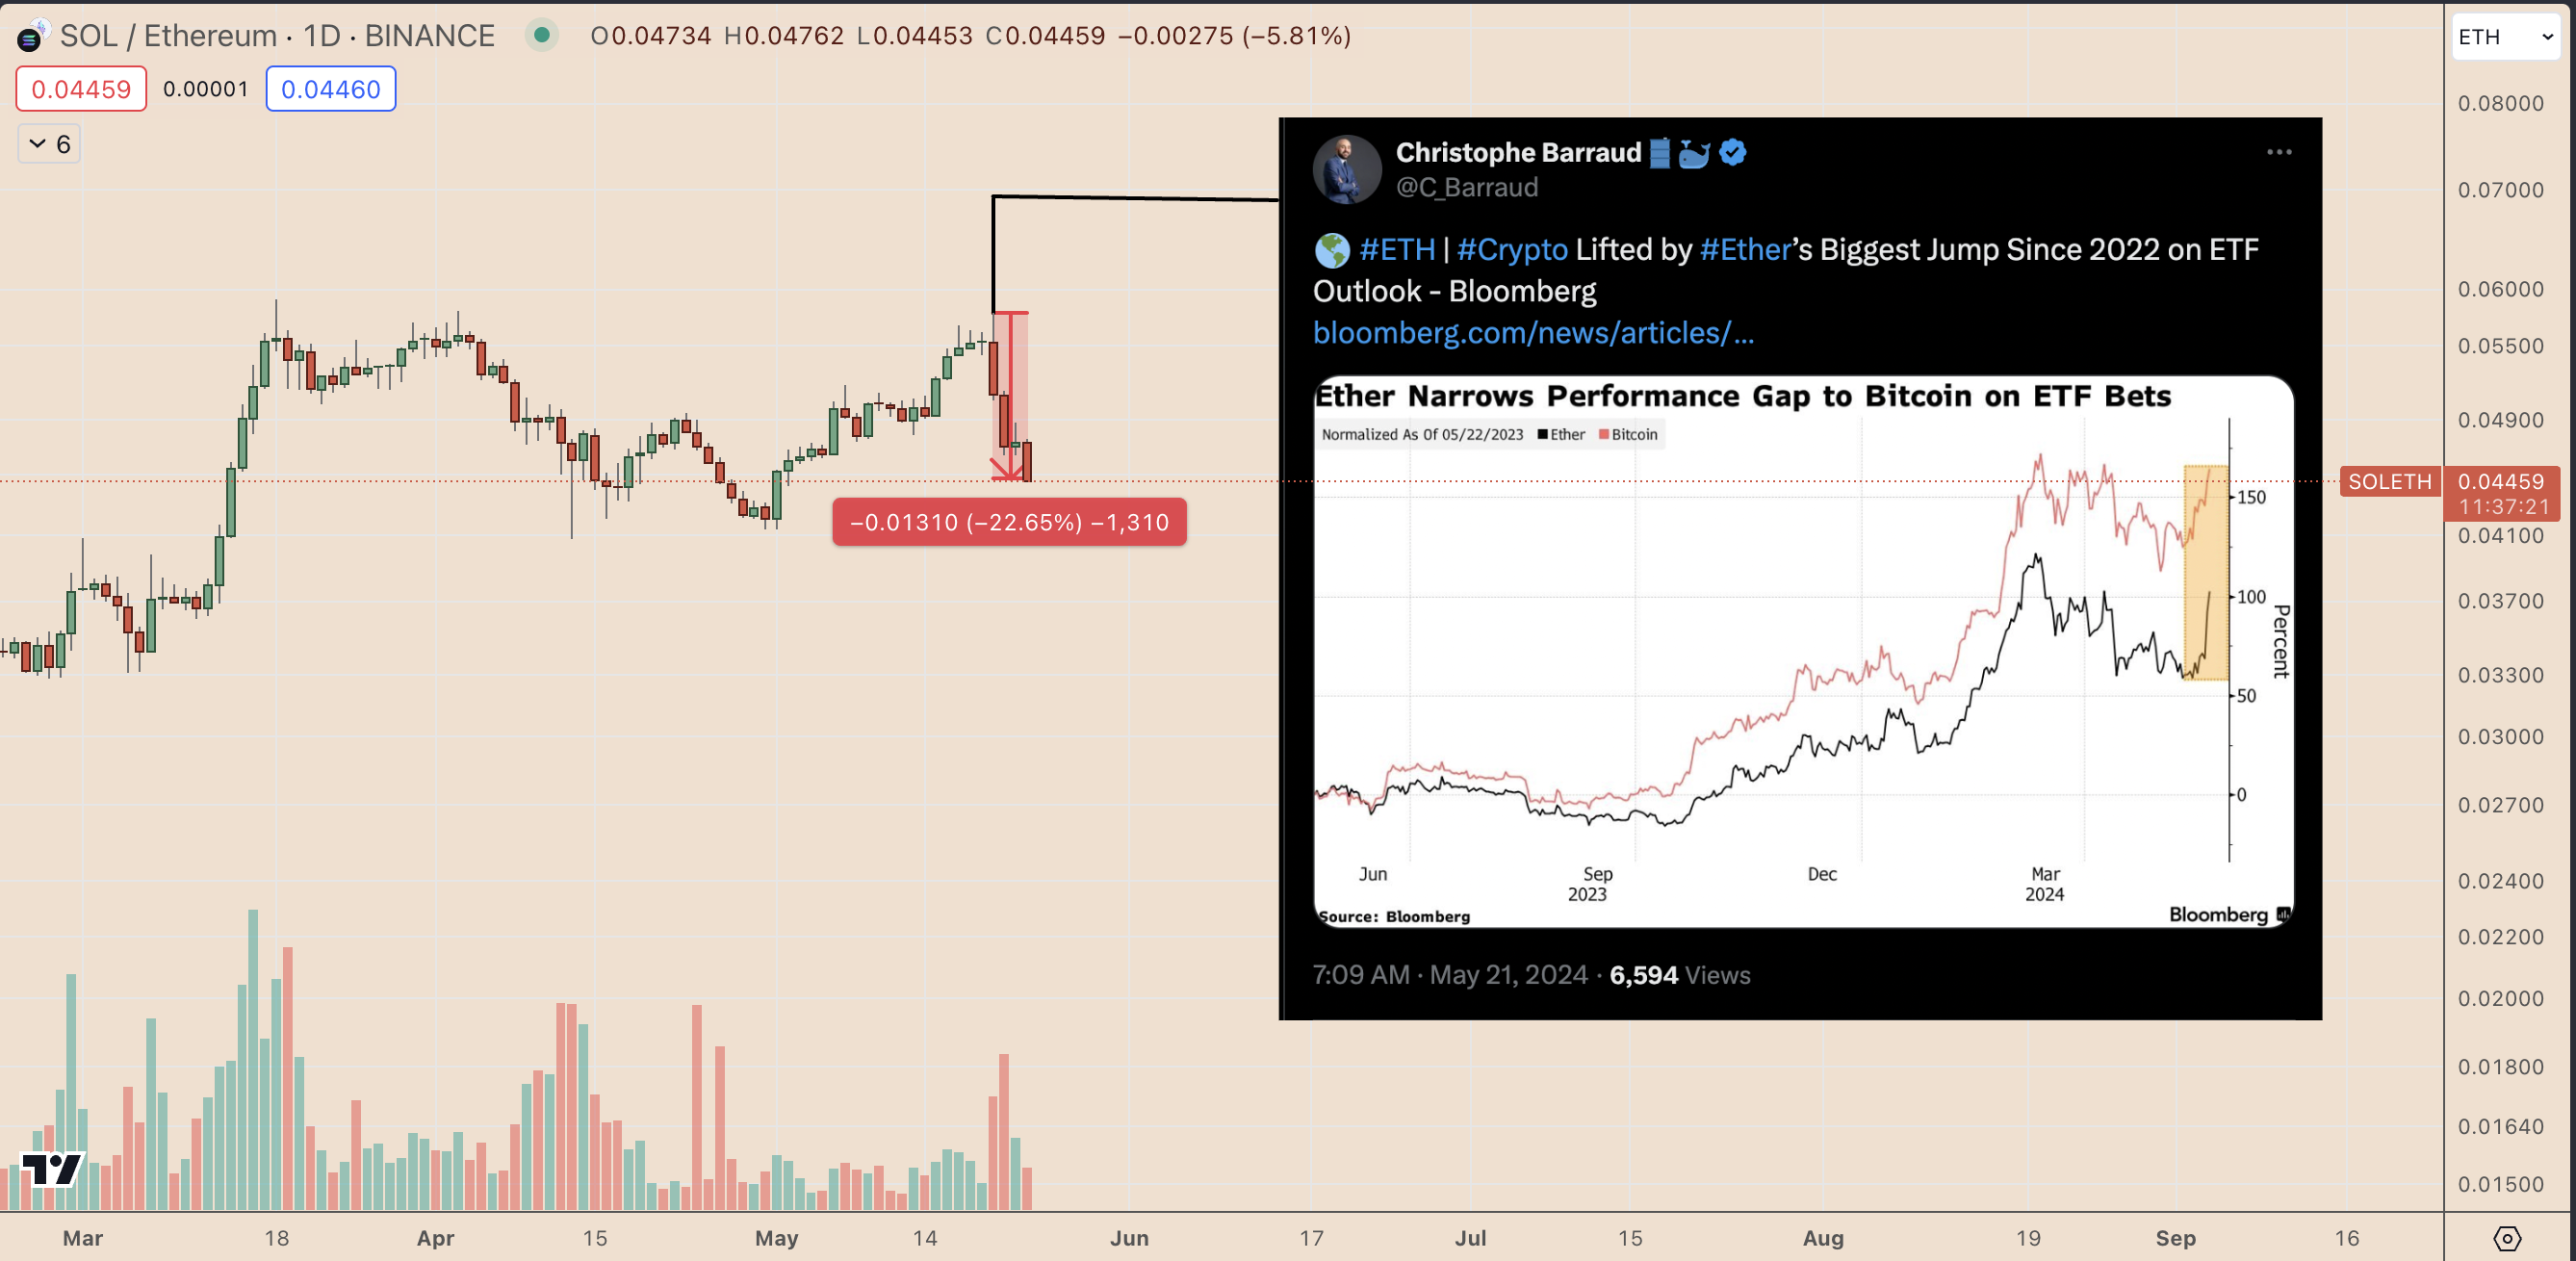
SOL/ETH daily price chart. Source: TradingView
ETFs are popular investment vehicles because they allow investors to gain exposure to an asset without owning it directly. If spot Ether ETFs are approved, it could increase demand for ETH, as institutional investors and other market participants might prefer investing in Ethereum through these investment vehicles.
This potential shift in investment interest towards Ethereum could negatively impact Solana and its native token, SOL, as funds may flow out of Solana's ecosystem and into Ethereum.
Solana ecosystem is witnessing outflows
The total value locked (TVL) across the Solana ecosystem has dropped significantly in May. As of May 22, the Solana ecosystem had 27.68 million SOL locked, a decrease from its monthly high of 29.49 million SOL.
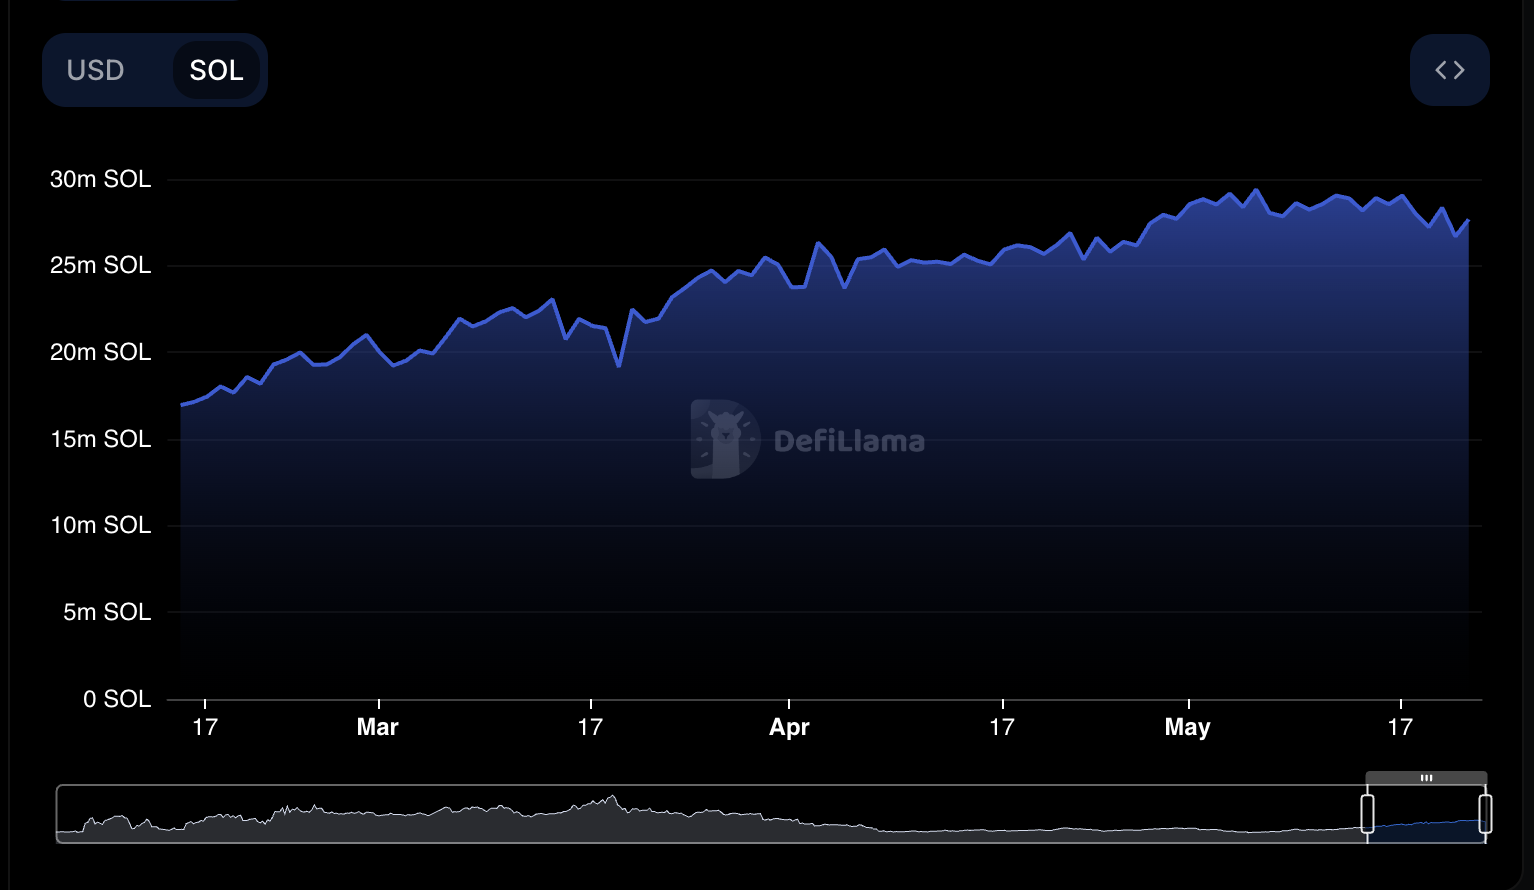
Solana TVL performance. Source: Defi Llama
Notably, the decline in Solana's TVL accelerated following the news on May 20 about the potential approval of spot Ether ETFs. On that day, the TVL stood at 28.34 million SOL, suggesting that the Ether ETF news may have contributed to the outflows from the Solana ecosystem.
A decline in Solana TVL indicates reduced confidence in the platform, prompting sell-offs and contributing to the SOL price drop.
SOL price: Overbought correction in progress
From a technical perspective, Solana's price declined after its daily relative strength index (RSI) approached the overbought level of 70. Additionally, a resistance confluence around $186, which included the 0.786 Fibonacci retracement line and a short-term ascending trendline, intensified selling pressure.
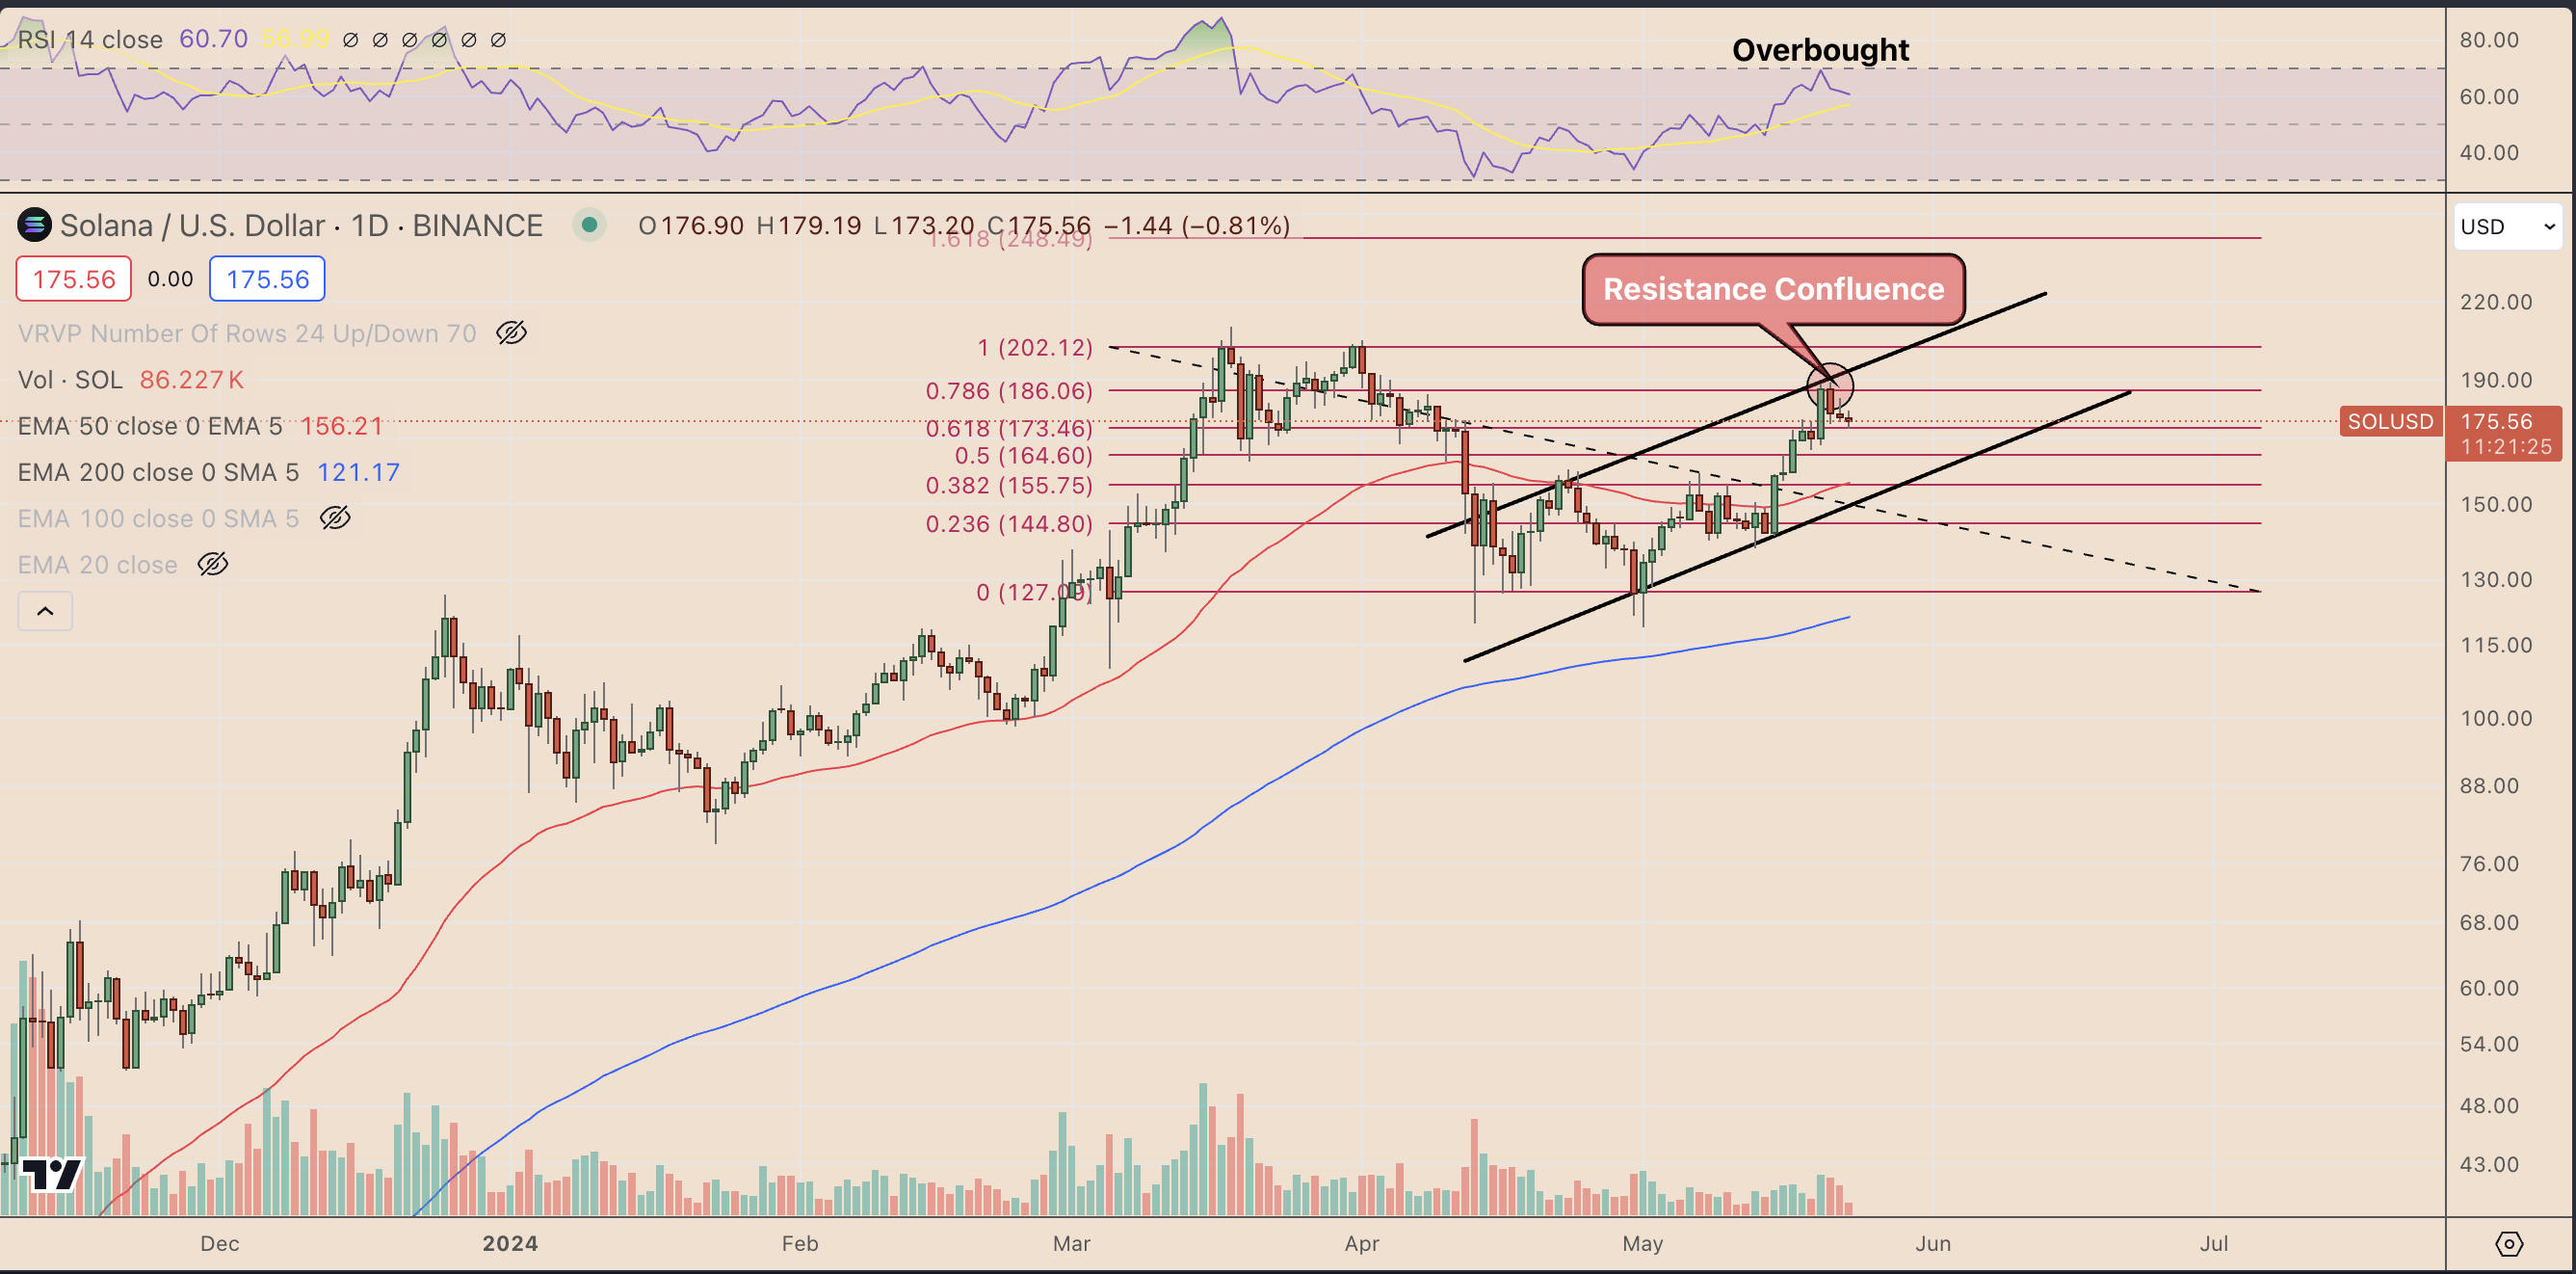
SOL/USD daily price chart. Source: TradingView
As of May 23, SOL was fluctuating inside a Fibonacci level range, with $186 acting as resistance and $173.50 acting as support. But, looking broadly, the cryptocurrency is trending inside an ascending parallel channel, which increases its likelihood of falling toward the lower trendline in May.
This lower trendline target aligns with SOL's 50-day exponential moving average (50-day EMA; the red wave) at around $155.75, down about 10.70% from the current price levels.
Author

Cointelegraph Team
Cointelegraph
We are privileged enough to work with the best and brightest in Bitcoin.


