Why Elrond’s EGLD price has potential even in a bear market
- EGLD price has printed an impulsive wave up, which could be the beginning phase of a larger rally.
- Elrond price shows an influx of selling pressure on the Volume Profile Indicator at the top of the rally, which hints that a correction will occur.
- A breach below $45 will invalidate the bullish potential.

Elrond’s EGLD price is one of the few cryptocurrencies still showing strength in the market. Traders should keep the digital asset on their watchlists in the coming days.
EGLD price has upward potential
Elrond price has become a wild card in the cryptocurrency space. While most cryptocurrencies have succumbed to Bitcoin’s demise, EGLD's price remains unfazed. The highly scalable blockchain token established an Elliott five-wave impulse between September 28 and October 17. The impulsive rally produced a 27% increase in market value for investors.
EGLD price currently auctions at $57.15. The bullish strength in crypto’s turbulent environment is certainly applaudable. However, one more correction may occur before the trend can continue.
The Volume Profile indicator confounds this idea as an influx of volume poured into the market at the top of the 27% rally. As the price rebounds higher, the volume momentum is waning. The Relative Strength Index (RSI) also shows bearish divergences between price and each new ascending high.
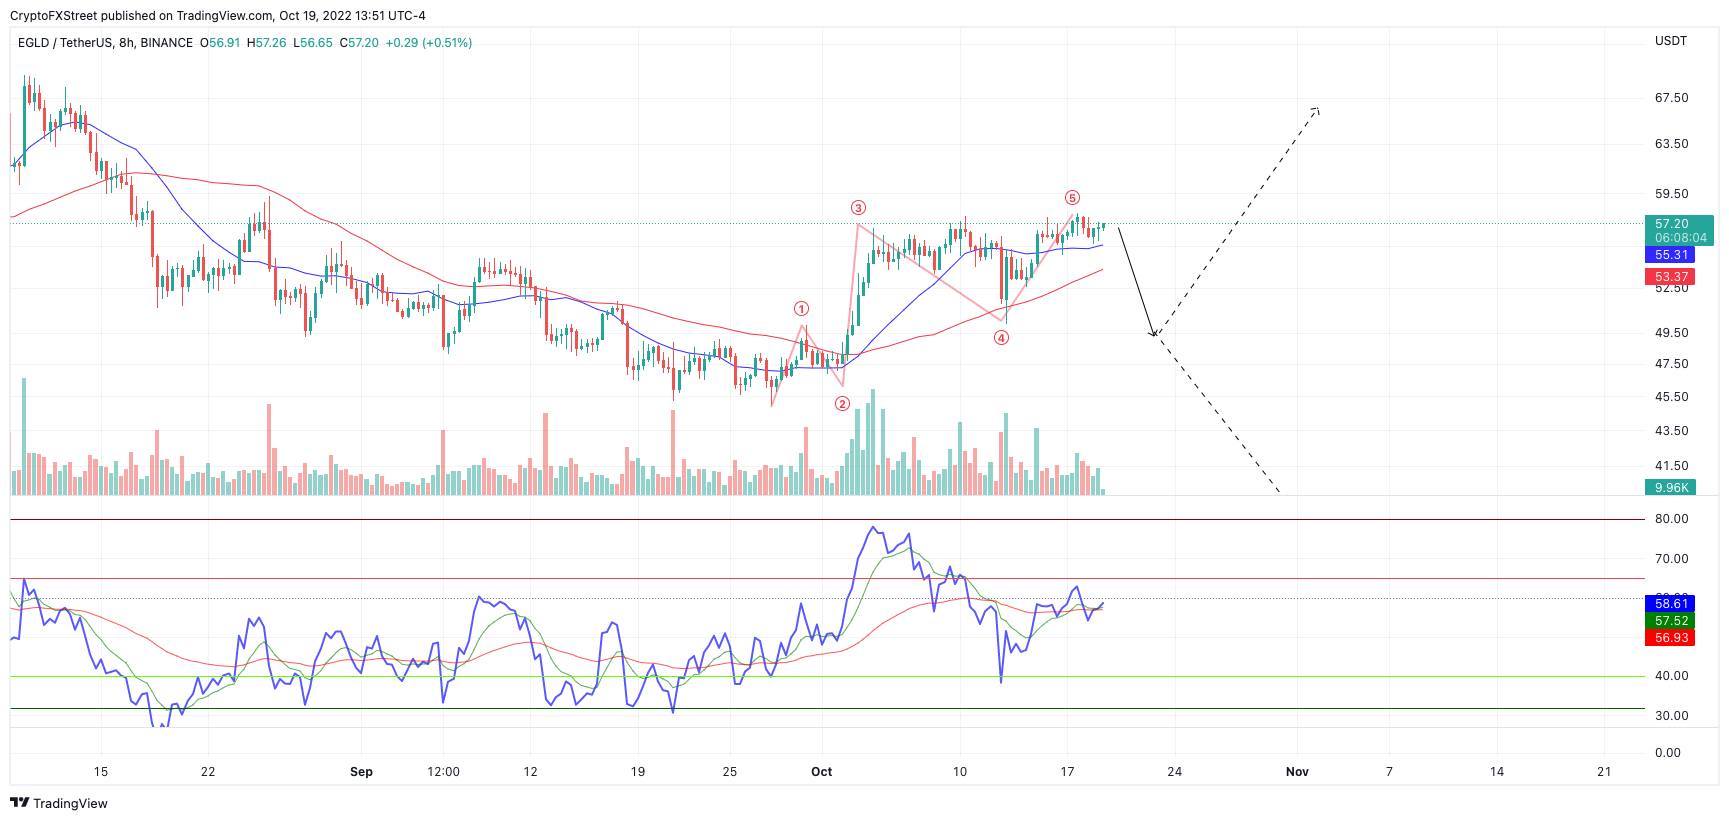
EGLD/USDT 8-Hour Chart
Combining these factors, EGLD price should witness a pullback towards the midpoint of the 27% rally in the coming days. If the market is genuinely bullish, hammer sticks and increased volume will surface near $48. A rally toward the $75 liquidity levels could occur afterward. Such a move would result in a 50% increase from the current market value.
Invalidation of the uptrend thesis is a breach below the origin point of the rally at $45. If the bears breach this level, consider the entire uptrend scenario void. The next bearish target lies at $40, resulting in a 30% decrease from the current EGLD price.
In the following video, our analysts deep dive into the price action of Bitcoin, analyzing key levels of interest in the market. -FXStreet Team
Author

Tony M.
FXStreet Contributor
Tony Montpeirous began investing in cryptocurrencies in 2017. His trading style incorporates Elliot Wave, Auction Market Theory, Fibonacci and price action as the cornerstone of his technical analysis.


