Why a $4 Polkadot price has resurfaced on Wall Street's table
- DOT price has breached the supportive zone on the RSI.
- Polkadot price shows a solid bearish presence on the Volume Profile indicator.
- Invalidation of the bearish thesis remains a breach above $10.

Polkadot's technicals are unfolding bearishly, hinting at strong high-cap influence.
Polkadot price looks severely bearish
Polkadot price shows bearish technicals that long-term investors should be aware of. Since July 3, the self-proclaimed "Ethereum Killer" smart contract and gaming token impulsively rallied an impressive 60%. In August, the rally was capped at 9.74, just below the $10 in the maro invalidation zone. Because the bulls failed to tag the macro invalidation point, the unfolding 30% decline could be the beginning of a much larger impulse wave headed south in the days to come.
Polkadot price currently auctions at $6.98, just above the bearish engulfing candle established on Friday, June 26. The Volume Profile indicator is the most concerning confluence signal despite the 60% rally that occurred throughout the summer. The bulls have not shown retaliative comparison to the bearish rallies prior. Additionally, the Relative Strength Index (RSI) has breached the supportive buyers' zone on the most recent downswing,
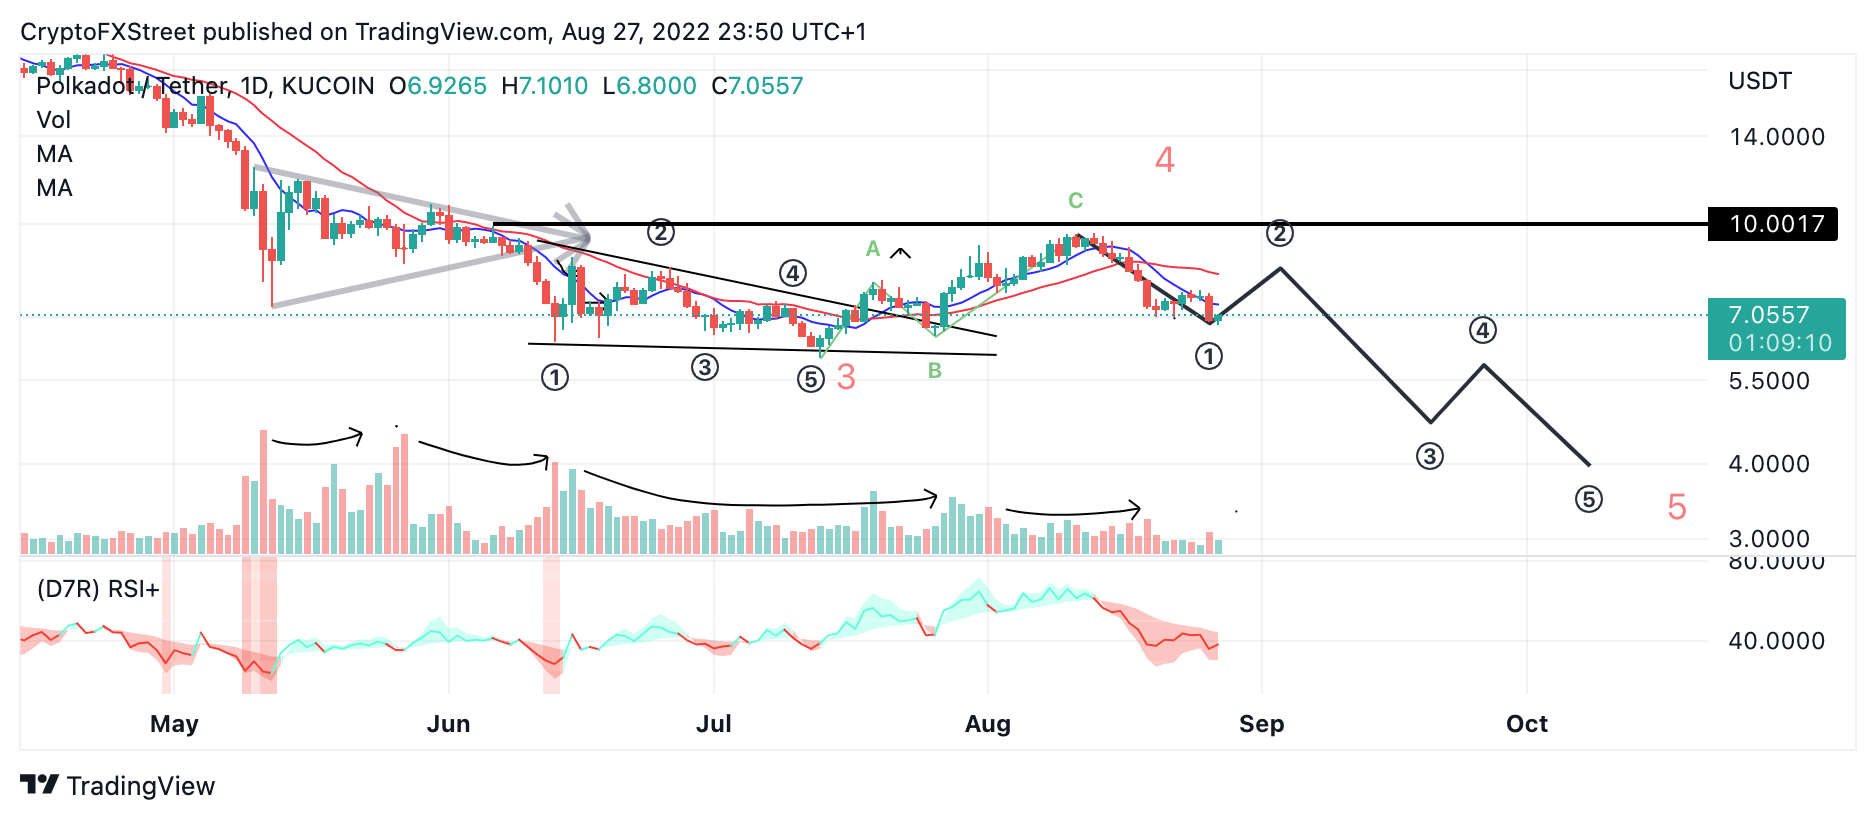
DOT/USDT 1-Day Chart
Combined, the technicals could show evidence of a larger impulse wave headed south with midterm targets at $4. Invalidation of the bearish thesis is still possible but should only be considered if the bulls can breach $10. In doing so, a bull run could commence targeting $14 in the midterm resulting in a 100% increase from the current Polkadot price.
In the following video, our analysts deep dive into the price action of Polkadot, analyzing key levels of interest in the market - FXStreet Team
Author

Tony M.
FXStreet Contributor
Tony Montpeirous began investing in cryptocurrencies in 2017. His trading style incorporates Elliot Wave, Auction Market Theory, Fibonacci and price action as the cornerstone of his technical analysis.


