|

Where to buy AVAX price to make big gains

  • AVAX price is lacking defense while retesting the parallel channel.
  • Avalanche price Relative Strength Index has more space to fall.
  • Invalidation of the bearish scenario is a close above $82.

AVAX price is being tested at its final wits as the bears have suppressed the price to $77. Traders can expect more decline in AVAX price if the bulls continue their lack of revolt.

AVAX price best entry is yet to be determined

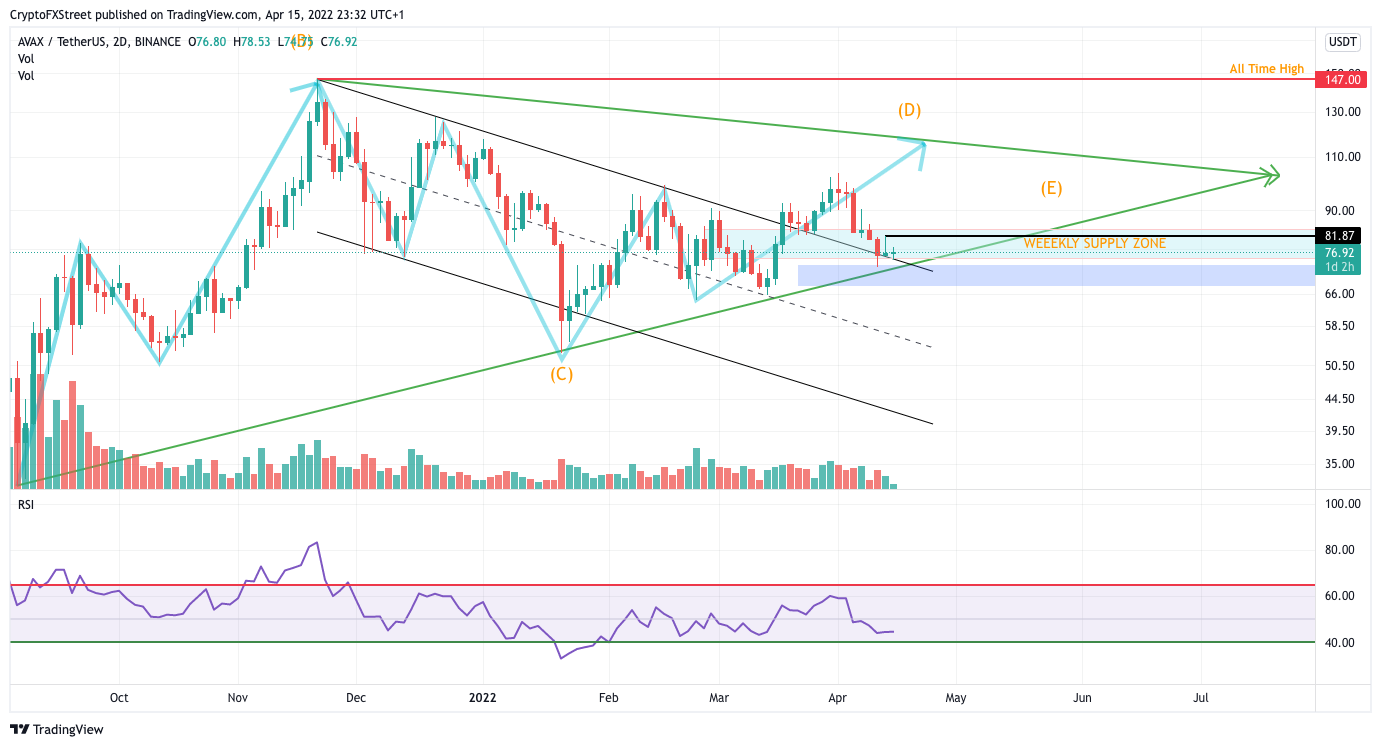
AVAX price is currently trading at $77 at the lower end of a weekly supply zone, still hovering above the breached parallel channel. The amount of time AVAX price is spending in this area is questionable for the bulls' strength. Avax presence has yet to indicate a second wind for the bullish scenario. 

Avalanche price volume indicator shows a lack of bullish interest as the price continues to print lower settling prices within the weekly zone. Traders looking for the classic break and retest strategy for the AVAX price may be fooled, as the price could still fall into lower targets while not entirely invalidating the bullish macro thesis.
TM/AVAX4.15.22

AVAX/USDT 2-Day Chart

The Relative Strength Index still has more space to fall which could confirm the lack of interest from the bulls at the current time. Invalidation of the bearish scenario will be a closing candle above $82. If this bullish event occurs, the $100 and $115 Avalanche price scenario will be back on the table, resulting in up to a 50% increase from the current AVAX price.

Author

FXStreet Team

Composed of a group of economic journalists and FX experts, the FXStreet content team produces and oversees all content published on FXStreet. It provides a purely journalistic approach to the Forex market.


More from FXStreet Team
Share:

Editor's Picks

Bitcoin Weekly Forecast: BTC retreats as macro headwinds grow
Bitcoin (BTC) remains under pressure, down over 4% this week and trading around $76,900 at the time of writing on Friday. Institutional demand shows signs of weakness as spot BTC Exchange Traded Funds (ETFs) are on track to end their three-week inflow streak, recording nearly $500 million in net outflows through Thursday.
XRP falls toward key support as macro uncertainty, weak momentum cap recovery
Ripple (XRP) falls below $1.33 on Friday, marking the third consecutive day of declines. The token continues to track the broader cryptocurrency market downturn, with investors closely monitoring heightened macroeconomic uncertainty ahead of the United States (US) Consumer Price Index (CPI) release and next week’s Federal Reserve (Fed) monetary policy decision.
Crypto Today: Bitcoin, Ethereum, XRP stabilize at lower levels amid ETF outflows and macroeconomic risks
The broader cryptocurrency market is rising on Friday, with Bitcoin (BTC) trading above $77,000 after testing lower support near $76,500. Ethereum (ETH) shows signs of stability, hovering above the support provided at $2,400 despite capped upside at $2,500. Meanwhile, Ripple (XRP) holds above $1.33 after three straight days of declines, reflecting growing headwinds due to macroeconomic uncertainty.
Bitcoin pulls back as another golden cross fails to deliver
Earlier this week, Bitcoin formed a golden cross, a technical signal that occurs when the price’s 50-day moving average rises above the 200-day moving average and is conventionally viewed as a precursor to a bullish rally. Historically, however, that’s often not been the case.
Bitcoin: BTC retreats as macro headwinds grow
Bitcoin (BTC) remains under pressure, down over 4% this week and trading around $76,900 at the time of writing on Friday. Institutional demand shows signs of weakness as spot BTC Exchange Traded Funds (ETFs) are on track to end their three-week inflow streak, recording nearly $500 million in net outflows through Thursday.

