Where Solana price will go next after erasing Monday’s gains
- Solana price sees its pennant formation morph into a bearish triangle.
- SOL price could dip below $35 and make new lows for the year.
- Expect to see a break towards either $30 or $18.66 before the bulls get involved.

Solana (SOL) price was in a pennant formation for most of May, but the pattern has shifted towards a bearish triangle as a support line has seen three tests already and pressure mounts with the dollar weighing in. Should the dollar rally further, expect a breakthrough that supports the level and a possible 15% to 26% price drop as more room gets opened to the downside. Expect to see the squeeze continuing until the bearish triangle completes and sees a break to the downside.
SOL price set to tank at least 15%
Solana price has surprised investors after a pennant formation that looked promising for a bullish breakout broke the other way. The Relative Strength Index (RSI), which is trading higher, away from the oversold area, appeared to confirm the pattern’s bullishness. Yet, instead, a bearish break materialised, which tested the bottom level of 2022 at $35 again. This level has held on three previous occasions but this time it is starting to weaken as pressure mounts, with lower highs and a downside squeeze.
SOL price could thus be set for another leg lower as some more dollar strength kicks in again. With the dollar weighing additionally on sentiment, it looks almost certain that SOL price could drop towards $18.66, with the monthly S1 support level just above at $22. Such a fall would constitute a 50% loss, while the earlier supportive level identified comes at the $30 equivalent to a 26% devaluation.
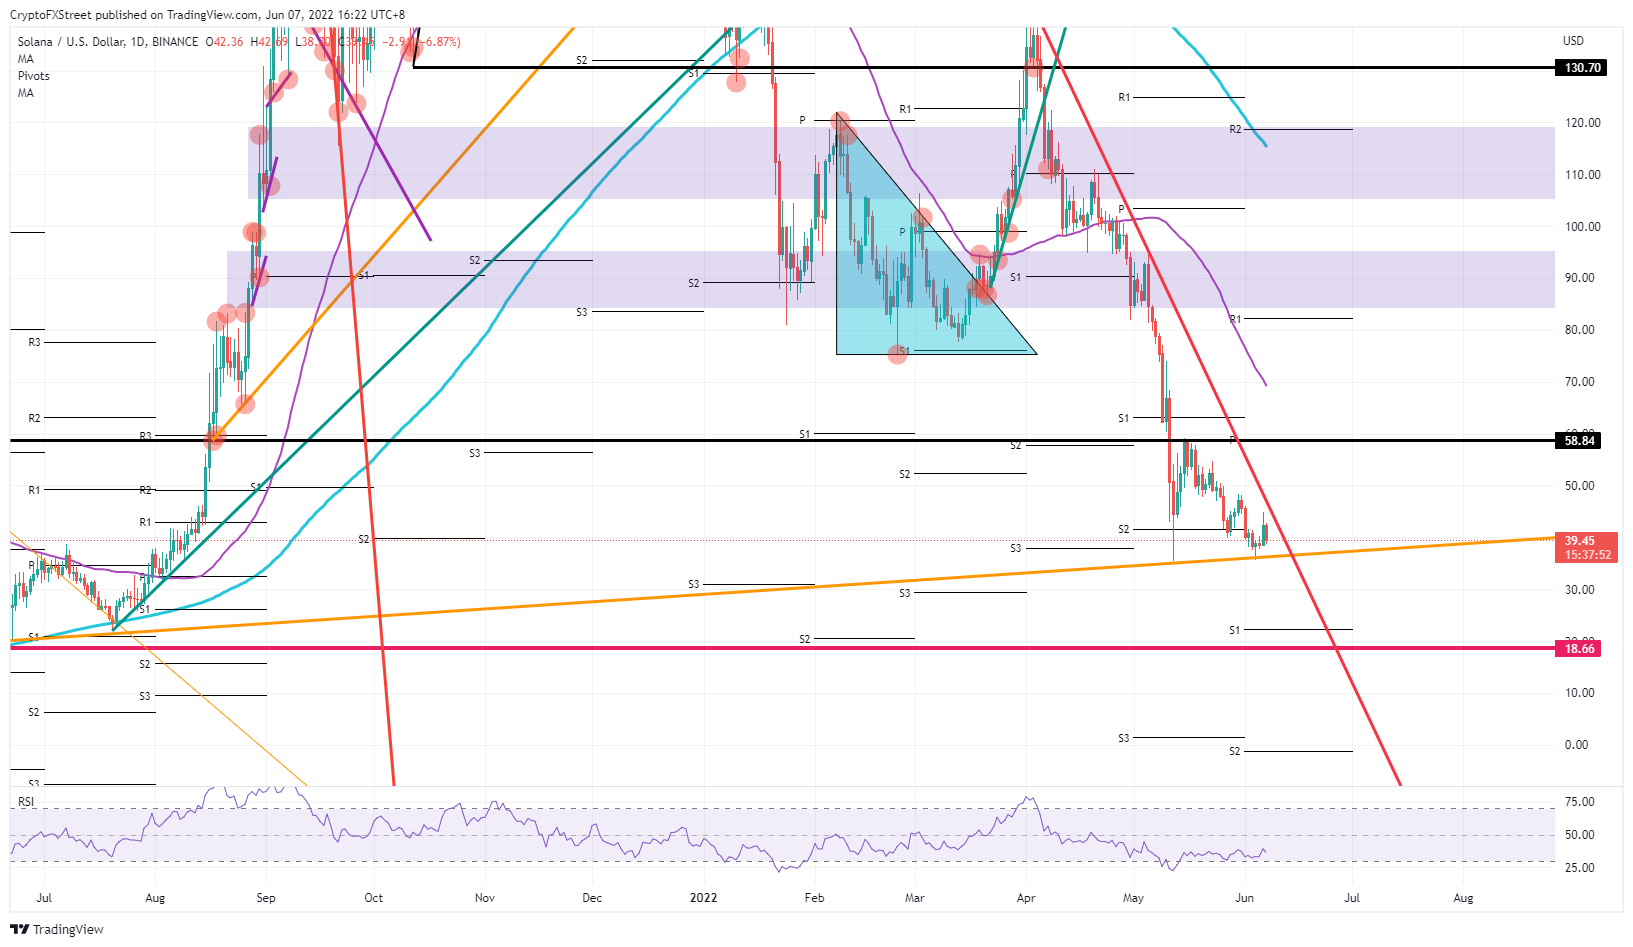
SOL/USD daily chart
Given the bank holiday in Europe yesterday, a turnaround could come today if the dollar weakens a bit instead and the sentiment in the global market gets to shift a bit with more positive morale. That would trigger another rebound of $35 and see bulls piercing through $58.84. At that level, $70 looks tempting, and bulls could charge ahead to test the 55-day Simple Moving Average, printing a 86% gain for the portfolio in the process.
Author

Filip Lagaart
FXStreet
Filip Lagaart is a former sales/trader with over 15 years of financial markets expertise under its belt.



