All evidence points to a crash in Solana price to this level
- Solana price briefly swept below the $37.37 support level, creating another lower low.
- The upside for SOL is capped due to the recent flip of the $41.25 high-time-frame support into a resistance barrier.
- A four-hour candlestick close below $31.76 will further exacerbate the bearish outlook and crash SOL to $24.54.

Solana price has been trying to recover for a long time but over the past month, it has breached not one but four support floors. This downtrend persists on the daily time frame, but there might be a minor relief rally for SOL before the bearish onslaught continues.
Solana price fumbles
Solana price action consolidated between the $41.25 support level and the $55.97 hurdle for roughly three weeks since May 12. However, due to the bearish outlook of the crypto market and SOL investors losing faith in the blockchain, things have worsened.
This development is visible in the price action as Solana price has crashed below the $55.97 and $41.25 high-time frame-support levels, flipping them into resistance barriers. Due to the recent breakdown of the $41.25 barrier, things have become much worse, forecasting a potential crash to $24.54.
While bearish, investors can expect a minor uptick in buying pressure, leading to a relief rally that attempts to retest the $41.25 and $44.31 hurdles. Rejection at these levels is likely to plummet SOL to $31.76.
But a breakdown of the aforementioned level could wreak havoc and crash Solana price to $24.54, signaling a total loss of 35% from the current position at $37.91.
As a result, SOL crashed 21% and shattered the $41.25 support floor, flipping things bearish. While a failure to recover above the said hurdle would pose threats to the gains of Solana price, investors need to pay close attention to the $37.37 level.
This support level is key in making or breaking the situation for SOL bulls. A breakdown of this foothold will confirm a bearish onslaught and knock Solana price further by 15% to retest the $31.59 barrier. In some cases, the bears might extend this downtrend to retest $30.
If the sellers continue to panic sell, a revisit of the $24.54 barrier seems plausible, denoting a total loss of 34%.
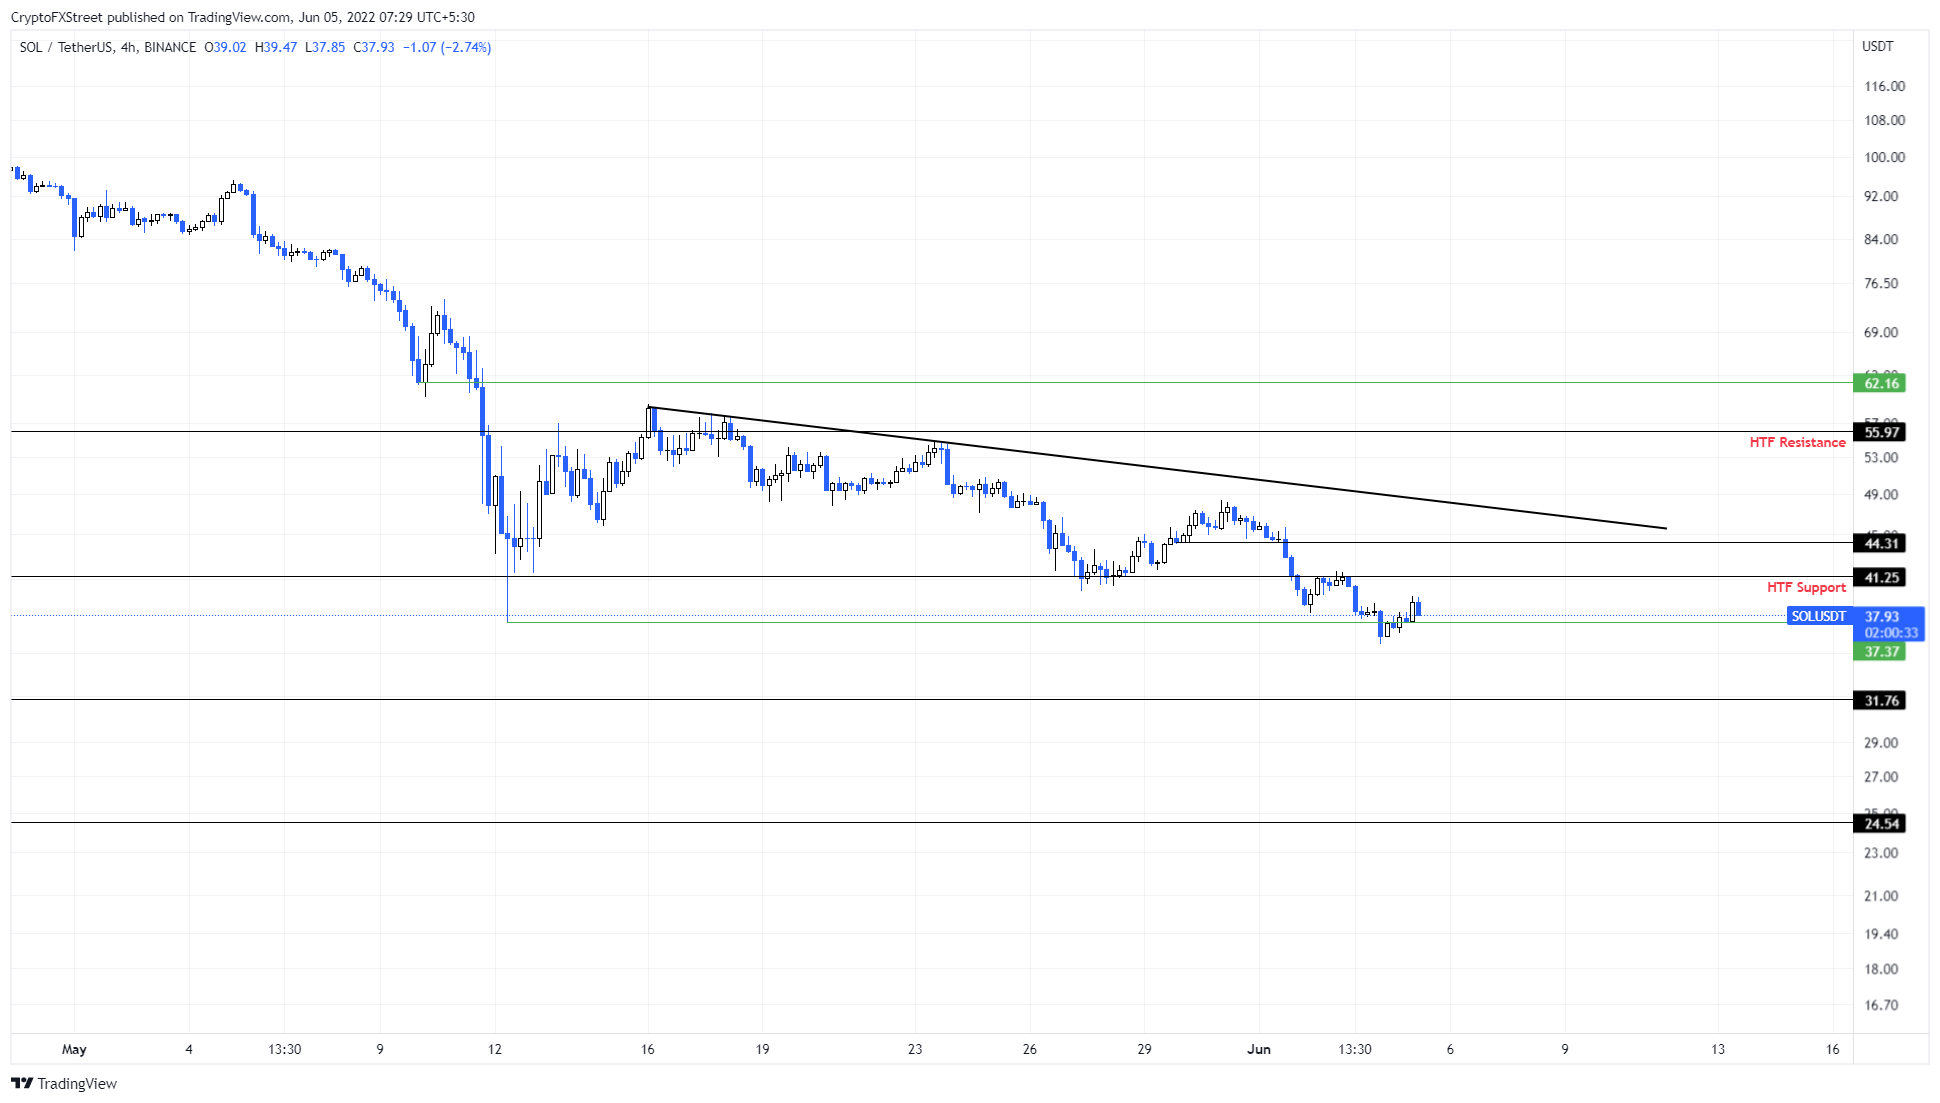
SOL/USDT 4-hour chart
While things are looking gloomy for Solana price, a four-hour candlestick close above the $55.97 hurdle will create a higher high and invalidate the bearish thesis. Such a move could further propel SOL to the next hurdle at $62.16.
Author

Akash Girimath
FXStreet
Akash Girimath is a Mechanical Engineer interested in the chaos of the financial markets. Trying to make sense of this convoluted yet fascinating space, he switched his engineering job to become a crypto reporter and analyst.



