Where can we expect Ethereum’s rally to $6,000+ to pause?

In our last update from a month ago, we shared two Elliott Wave (EW) Principle views, both leading to much higher prices for Ethereum (ETHUSD), and one of which was
“…the red W[ave]-i to peak at … approximately $3,000 for ETH. From there, we can still expect a deeper red W-ii to ideally be around $2,250 +/- $75, before the red W-iii kicks in. However, the bears will need to push the price back below … $2385 to initiate this alternative.”
ETHUSD peaked at $2,879 on June 11, fell to $2,213 on June 22, and is now trading around $3,400. See Figure 1 below. Therefore, anyone following our analysis, such as our premium newsletter members, would have had one last low-risk/high-reward setup in late June, which has now played out. Moving forward, we should look for corrective pullbacks along the way to at least $4,500+.
Figure 1. Our preferred short-term EW count for Ethereum
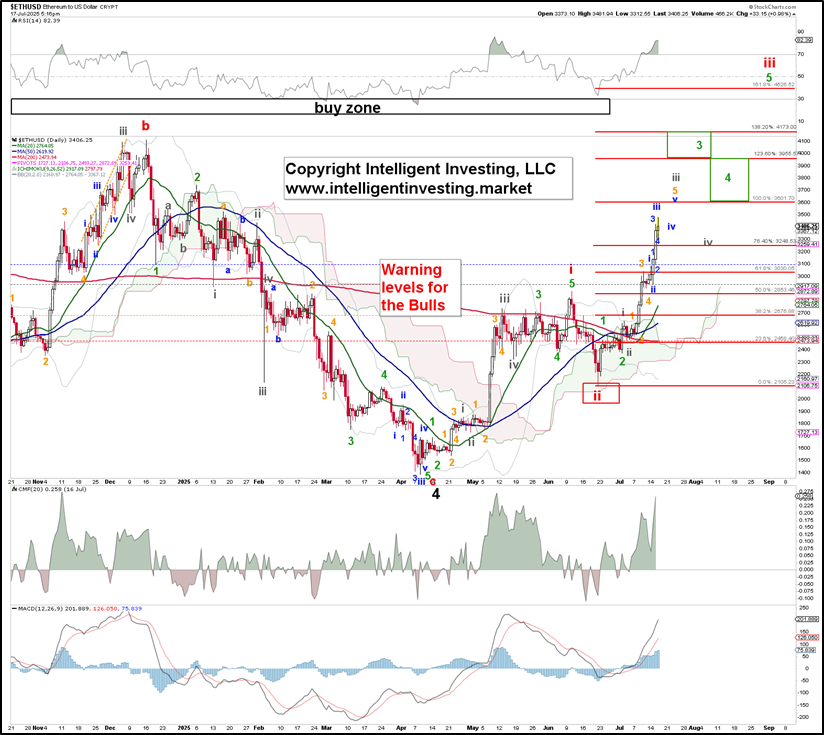
In this case, we expect the first short-term top to materialize around the red 100% Fibonacci extension, approximately $3,600, for the gray W-iii—a typical 3rd of a 3rd of a 3rd wave target. The subsequent multi-day gray W-iv correction should ideally stall out at around the 76.40% level ($3250ish) before the gray W-v aims for the 123.60-138.20% extensions ($3955-4175), etc. We don’t see a more severe (multi-week) correction play out until the red W-iii has been completed at ideally the 161.8% level: ~$4525.
How does this fit into the bigger picture, one may ask? Remember, three months ago, we demonstrated that Ethereum was nearing the end of its downtrend.
“…. [it] can still wrap up at least one more set of 4th and 5th waves to the ideal $1085ish target zone to complete the more significant (black) 4th wave. However, if ETH moves above at least the 50-d SMAs, the DT line, and $2093 without making a lower low first, we must consider the four-month-long downtrend complete and look towards the low $6000s over the next several months.”
Ether failed to reach that target, having bottomed out at $1,384 on April 9, and then moved above its 50-day SMA and downtrend line, thus indicating that the rally to $6,000+ was underway. That target was set based on the large Bull flag pattern that was forming. See Figure 2 below.
Figure 2. Our preferred long-term EW count for Ethereum
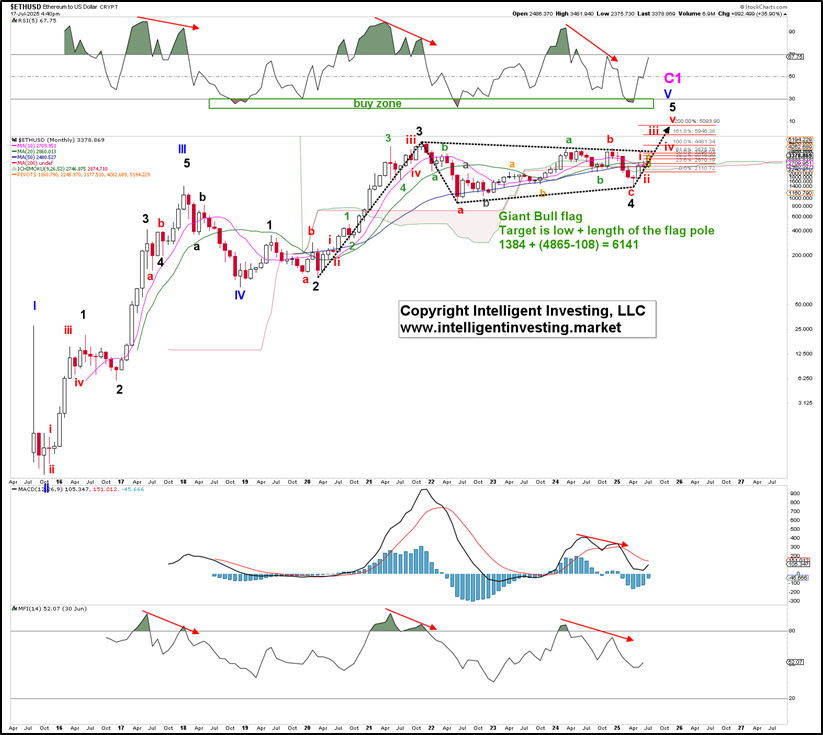
Applying the short-term to intermediate-term wave count to the price action in Figure 2 (red Fibonacci extensions), we see that the ideal (200%) 5th wave (red W-v) target for the rally from the April low is approximately $5095. The pennant formation targets $6140, and therefore, there is already a reasonable agreement between the two. Additionally, 5th waves in cryptocurrencies tend to extend, and a 300% Fib-extension targets the $6190s, which aligns even better.
Lastly, Ether has now moved above its 10 to 50-month SMAs as well as its monthly Ichimoku Cloud, signaling a renewed long-term uptrend, adding weight to the evidence for much higher prices to come.
Author

Dr. Arnout Ter Schure
Intelligent Investing, LLC
After having worked for over ten years within the field of energy and the environment, Dr.


