Ethereum price spells trouble as support weakens
- Ethereum price sees pennant stretched into a bearish triangle.
- ETH price could be on the cusp of dropping another leg lower.
- If bears have it their way, expect to see another 26% devaluation.

Ethereum (ETH) price is sending a warning signal to the markets this morning as the ASIA PAC session saw a complete reversal of its gains from Monday. With European markets opening after a bank holiday, positive sentiment has been dented and seen a squaring back of incurred gains. Risk comes for ETH with another test of important support that, once it gives way, could see a drop towards $1,243.89, and 26% of incurred losses.
ETH price is on the cusp of dropping 26%
Ethereum price is in distress as a pennant pattern transmutes into a bearish triangle with lower highs and bears pushing bulls to the downside, forcing them to sell and triggering a break below $1,688.39, the low of 2022. That level has withstood two tests already and looks ready for a third, but given the formation of the bearish triangle and continued dollar strength, the level may not hold for a rebound this time. The Relative Strength Index (RSI) has moved up these past few days and bears now have the room and the incentive to trigger another leg lower in price action.
ETH price will continue its squeeze to the downside as bulls get squashed against the $1,688.39 level. Pressure from above comes from dollar strength and risk-off sentiment in the markets today, and the overall downtrend is still very much in play for Ethereum price. With pressure mounting, expect to see a drop towards $1,400, with the monthly S1 nearby trying to contain any losses. After the 16% losses already incurred, a further slippage towards $1,243.89 would bring that to a total of 26%.
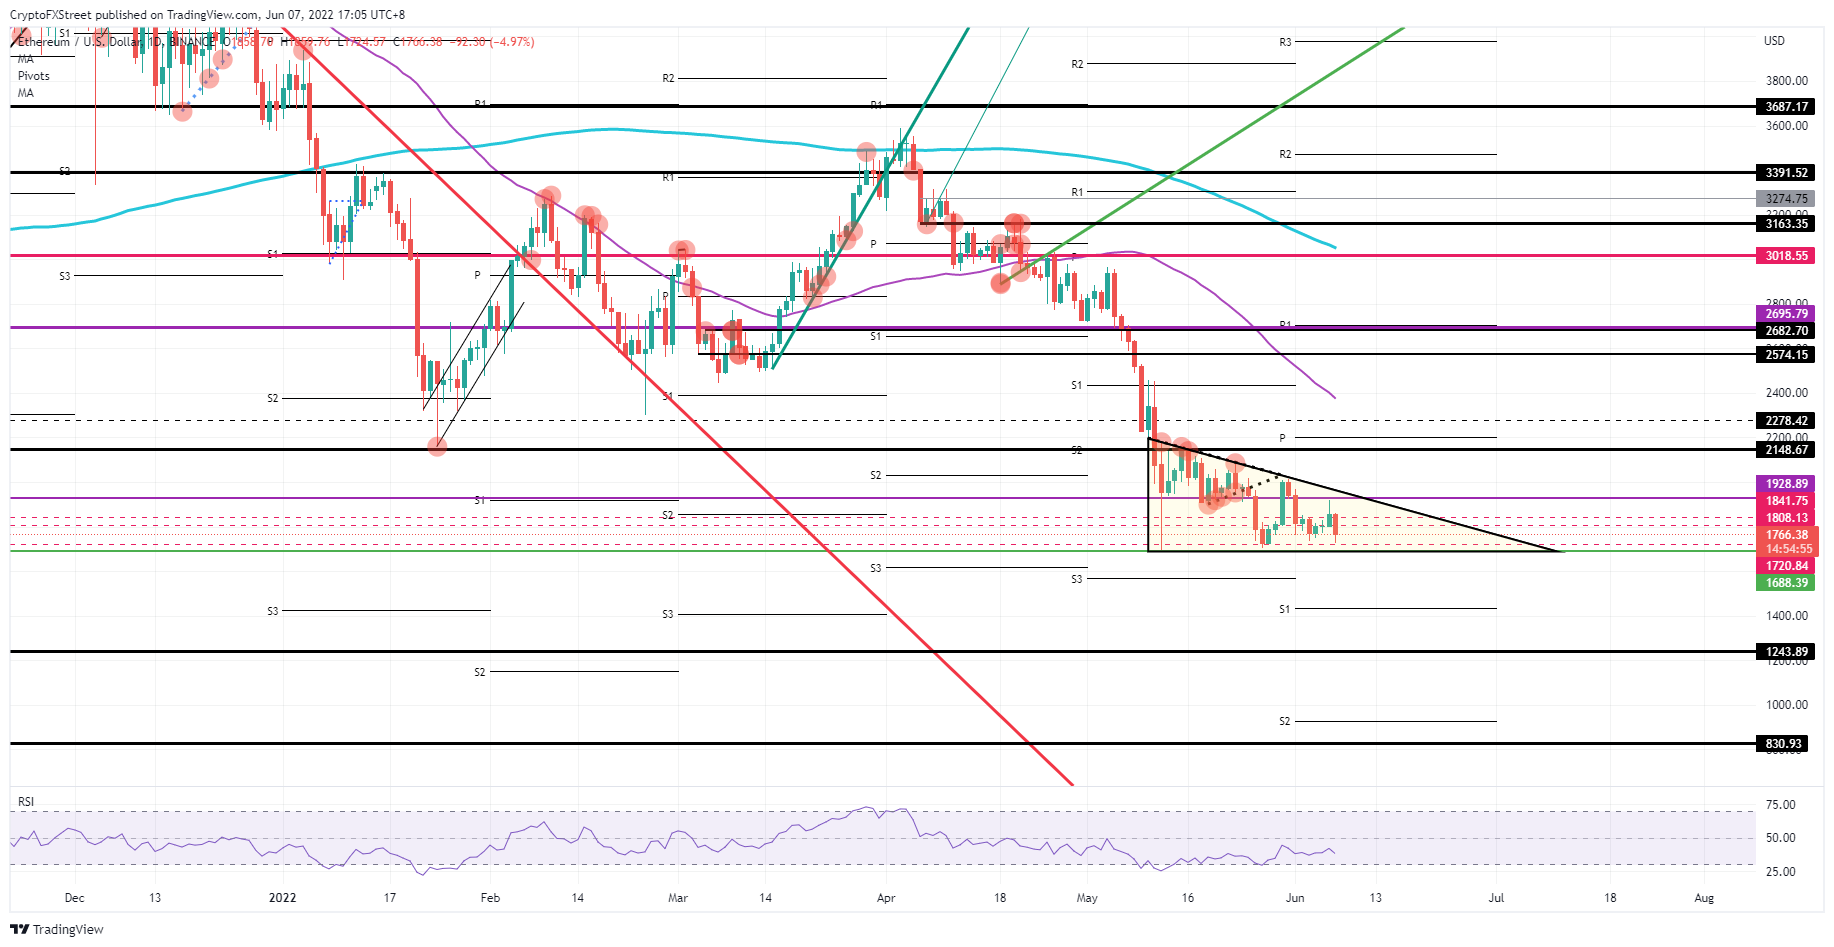
ETH/USD daily chart
Markets could still be spun 180 degrees if geopolitical themes fade more to the background, lending ETH price a spark to rally. In such a scenario, expect to see $1,928.89 toppled and bulls quickly hitting $2,148.67, which would simply be a paring back of the losses from May. Another leg higher would see $2,695.79 on the radar with the monthly R1 and the purple pivotal level both present as a firm wall to be tested, as by then, the 55-day Simple Moving Average will have been broken to the upside.
Author

Filip Lagaart
FXStreet
Filip Lagaart is a former sales/trader with over 15 years of financial markets expertise under its belt.


