|

Ethereum turns down, but stays above the 1685 zone

ETH/USD traded slightly lower today, after hitting resistance near the 1850 zone. However, although the crypto is trading below the downside resistance line drawn from the high of May 15th, it remains above the key support area of 1685, thereby forming a descending triangle pattern. That triangle is also below a longer-term downside line, drawn from the high April 3rd, and thus, we see more chances for the price to exit the triangle to the downside rather than to the upside.

A clear and decisive break below 1685 would confirm a forthcoming lower low on both the 4-hour and daily charts and may encourage the bears to push the action towards the 1395 territory, which provided support between February 23rd and March 1st, 2021. If they are not willing to stop there, then we may see them pushing towards the 1205 territory, marked by the low of January 22nd, 2021.

Shifting attention to our short-term oscillators, we see that the RSI, already below 50, turned down, while the MACD lies below both its zero and trigger lines, pointing south as well. Both indicators detect downside speed and add to the case of the crypto exiting the triangle through its lower bound.

Now in order to start examining whether the bulls have stollen all the bears’ swords we would like to see, not only a break above the upper bound of the triangle, but also a break above the aforementioned longer-term downside line, and the 2455 territory, marked by the high of May 10th. We could then see advances towards the 2745 barrier, marked by the inside swing lows of April 27th and May 3rd, the break of which could extend the gains towards the 2975 zone, marked by the highs of April 28th and May 4th.
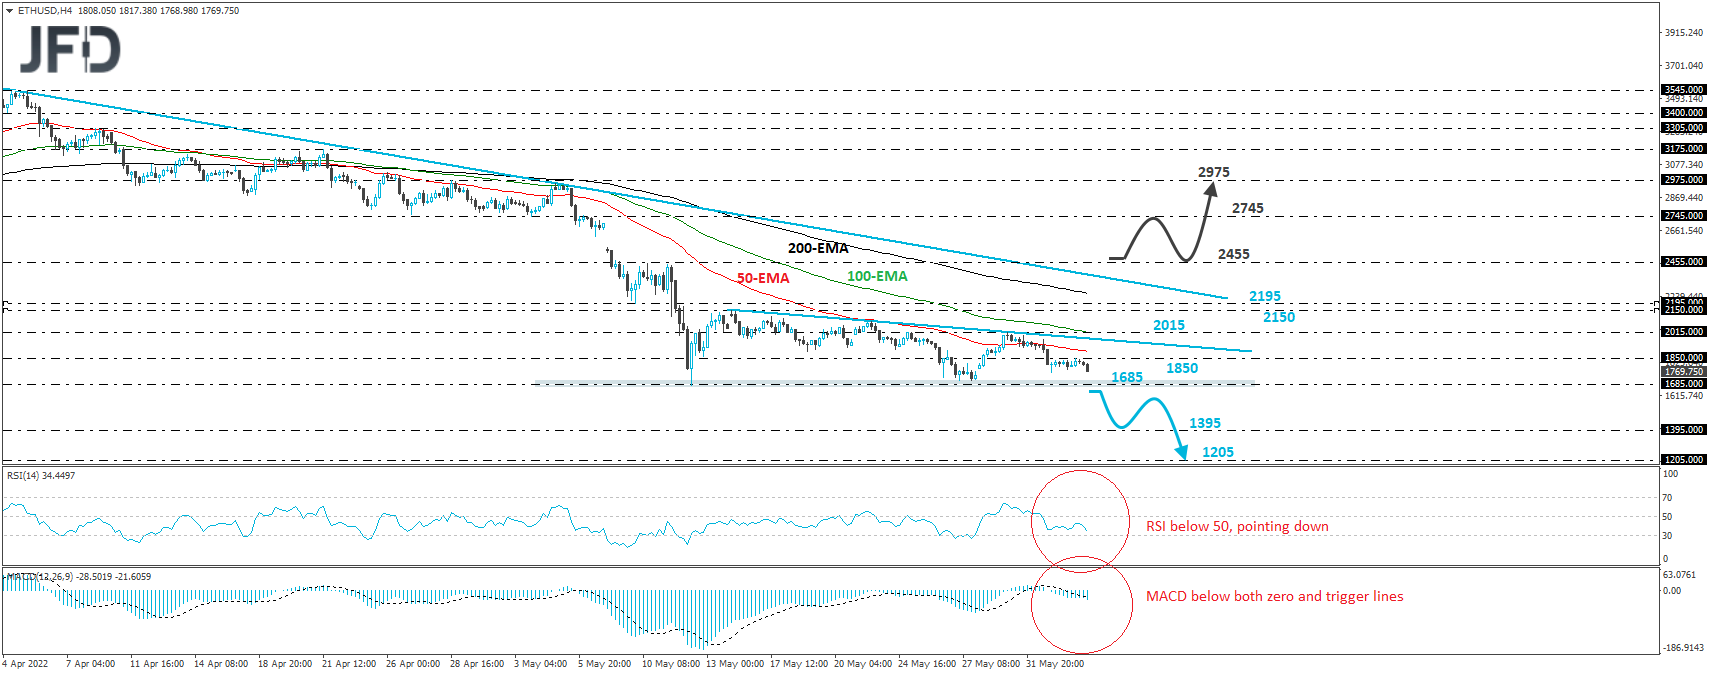
Ethereum ETH/USD 4-hour chart technical analysis

Author

More from JFD Team
Share:

Editor's Picks

Bitcoin Weekly Forecast: BTC retreats as macro headwinds grow
Bitcoin (BTC) remains under pressure, down over 4% this week and trading around $76,900 at the time of writing on Friday. Institutional demand shows signs of weakness as spot BTC Exchange Traded Funds (ETFs) are on track to end their three-week inflow streak, recording nearly $500 million in net outflows through Thursday.
XRP falls toward key support as macro uncertainty, weak momentum cap recovery
Ripple (XRP) falls below $1.33 on Friday, marking the third consecutive day of declines. The token continues to track the broader cryptocurrency market downturn, with investors closely monitoring heightened macroeconomic uncertainty ahead of the United States (US) Consumer Price Index (CPI) release and next week’s Federal Reserve (Fed) monetary policy decision.
Crypto Today: Bitcoin, Ethereum, XRP stabilize at lower levels amid ETF outflows and macroeconomic risks
The broader cryptocurrency market is rising on Friday, with Bitcoin (BTC) trading above $77,000 after testing lower support near $76,500. Ethereum (ETH) shows signs of stability, hovering above the support provided at $2,400 despite capped upside at $2,500. Meanwhile, Ripple (XRP) holds above $1.33 after three straight days of declines, reflecting growing headwinds due to macroeconomic uncertainty.
Bitcoin pulls back as another golden cross fails to deliver
Earlier this week, Bitcoin formed a golden cross, a technical signal that occurs when the price’s 50-day moving average rises above the 200-day moving average and is conventionally viewed as a precursor to a bullish rally. Historically, however, that’s often not been the case.
Bitcoin: BTC retreats as macro headwinds grow
Bitcoin (BTC) remains under pressure, down over 4% this week and trading around $76,900 at the time of writing on Friday. Institutional demand shows signs of weakness as spot BTC Exchange Traded Funds (ETFs) are on track to end their three-week inflow streak, recording nearly $500 million in net outflows through Thursday.


