What to expect from Chainlink price as LINK looks to escape this supplier congestion zone
- Chainlink price is trapped between the 200- and 50-day EMAs as horizontal trading continues.
- LINK could breach the $7.37 resistance level before a northbound move toward the critical resistance at $7.65.
- A daily candlestick close below the 100-day EMA at $7.00 could invalidate the bullish thesis.
-637336005550289133.jpg)
Chainlink price (LINK) has been trapped under a critical resistance level for a while, causing the altcoin to trade horizontally as it enjoyed strong downward support. The struggle came amid the indecisive price action from Bitcoin (BTC), which kept several other altcoins in limbo despite the alt season.
Chainlink price eyes 5% gains to escape key barrier
At the time of writing, Chainlink price is at $7.40, after losing 0.77% in the last 24 hours. However, trading activity over the same timeframe is up almost 35% as bulls and bears each push for lead to escape the formidable supplier congestion zone.
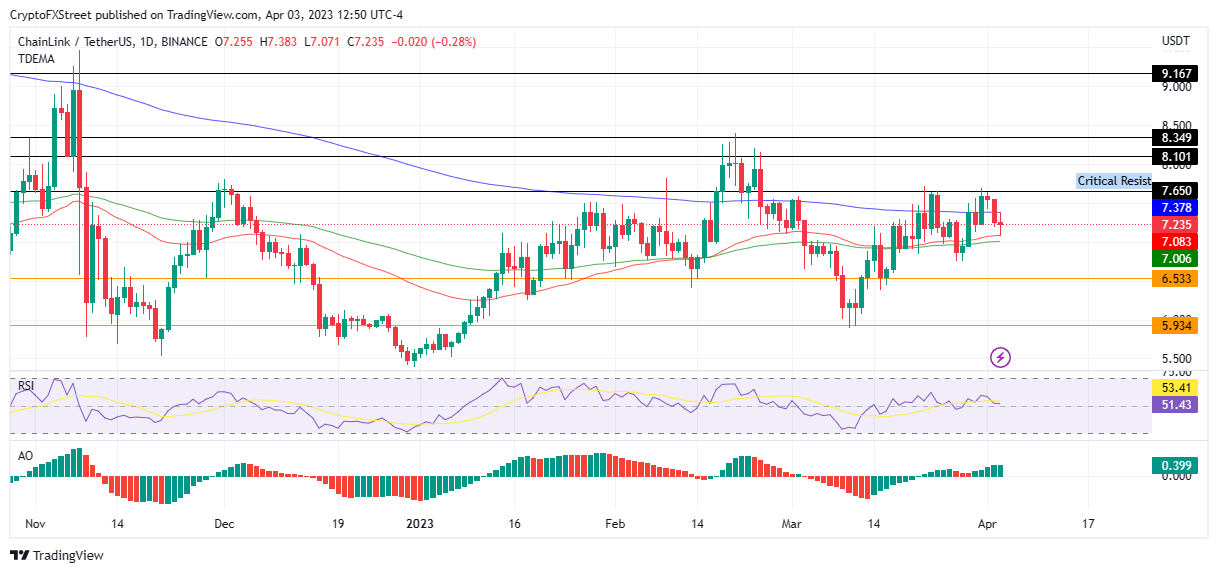
Chainlink price is attempting to consolidate above the 200-day Exponential Moving Average (EMA) at $7.37. On the other hand, the 50-day EMA at $7.08, bolstered by the 100-day EMA at $7.00, keeps LINK afloat. Accordingly, downward support is stronger compared to overhead pressure.
If buyer momentum increases, Chainlink price could decisively break above the 200-day EMA and confront the critical resistance level at $7.65. Further north, LINK could break into the $8.00 range by shattering the $8.01 resistance level. In highly bullish cases, the altcoin could extend a neck up to tag the $8.34 resistance level, denoting a 16% ascent from the current price.
Breaking above the aforementioned level could allow Chainlink price to try reclaiming its lost glory before the FTX implosion solidified LINK’s market value below the critical resistance.
LINK/USDT 1-day chart
On-chain metric supports the bullish case for Chainlink price
Data from IntoTheBlock’s Global In/Out of the Money Around Price (GIOMAP) supports the bullish thesis for Chainlink price. This on-chain metric classifies addresses based on if they are profiting (in the money), breaking even (at the money), or losing money (out of the money) on their positions at the current price.
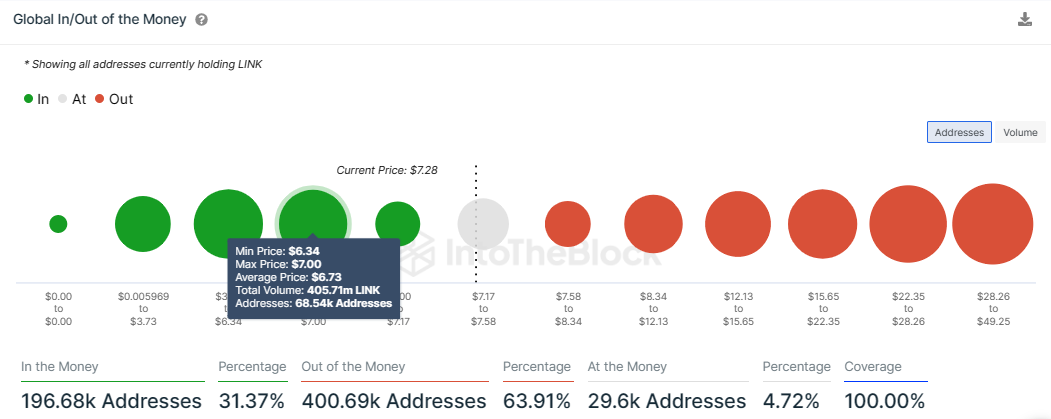
Based on the chart, Chainlink price sat on relatively robust support. For instance, part of the demand zone described above lies within the $6.34 and $7.00 price range, where approximately 405.71 million LINK were previously bought by roughly 68,540 addresses at an average price of $6.73.
Any attempt to push Chainlink price below the said level would be met by buying pressure from these investors who may want to increase their profits. The resultant demand surge would cause LINK to rise even higher in market value.
On the other hand, if seller momentum increases, Chainlink price could descend and lose the support offered by the 50-day EMA at $7.08. A drop below this supplier congestion level could fuel overhead pressure and increase the chances of LINK breaking below the 100-day EMA at $7.00. A daily candlestick close below this level would invalidate the bullish thesis.
With mounting overhead pressure due to the three EMAs, Chainlink price could suffer a free fall that could see LINK revisit the mid-March lows around the $6.53 support level. In highly extreme cases, the altcoin’s market value could fall through the $5.93 swing low before the possibility of a bounce. Such a drop would constitute a 20% descent from the current level.
Author

Lockridge Okoth
FXStreet
Lockridge is a believer in the transformative power of crypto and the blockchain industry.


