What does the recent Bitcoin price sell-off mean for the crypto ecosystem?
- Bitcoin price shows weakness as it gets rejected by the 200-week SMA at $22,559.
- A daily candlestick close below the $20,726 to $19,284 demand zone could trigger a sweep of $17,591.
- If BTC recovers and flips above the 200-week SMA at $22,559, it could attempt an upswing to $25,000.

Bitcoin price tried to breach through the significant and high-time frame resistance barrier but failed. As a result, the downswing that emerged pushed BTC lower and the June 11 sell-off has currently pushed it below the $20,000 psychological level.
Bitcoin price reveals its hands
Bitcoin price moved above the $17,591 to $21,706 range on July 8, indicating an overwhelming surge in buying pressure. This rally soaked up the selling pressure and still moved higher to retest the 200-week Simple Moving Average (SMA) at $22,559.
Due to the arduous nature of the journey, Bitcoin price and the bullish momentum faced exhaustion upon the retest, resulting in a sell-off. As a result, BTC dropped hard and fast and is currently approaching the midpoint of the aforementioned range at $19,649.
If this momentum continues, Bitcoin price is more than likely to retest and sweep the range low at $17,591. While this move is a conservative outlook, a daily candlestick close below this level will signal otherwise.
In such a case, investors can wait for a secondary confirmation, which will be a weekly close below the $19,000 level. Assuming bears manage to pull this off, the market participants can. expect the Bitcoin price to trigger a crash to the $15,000 psychological level.
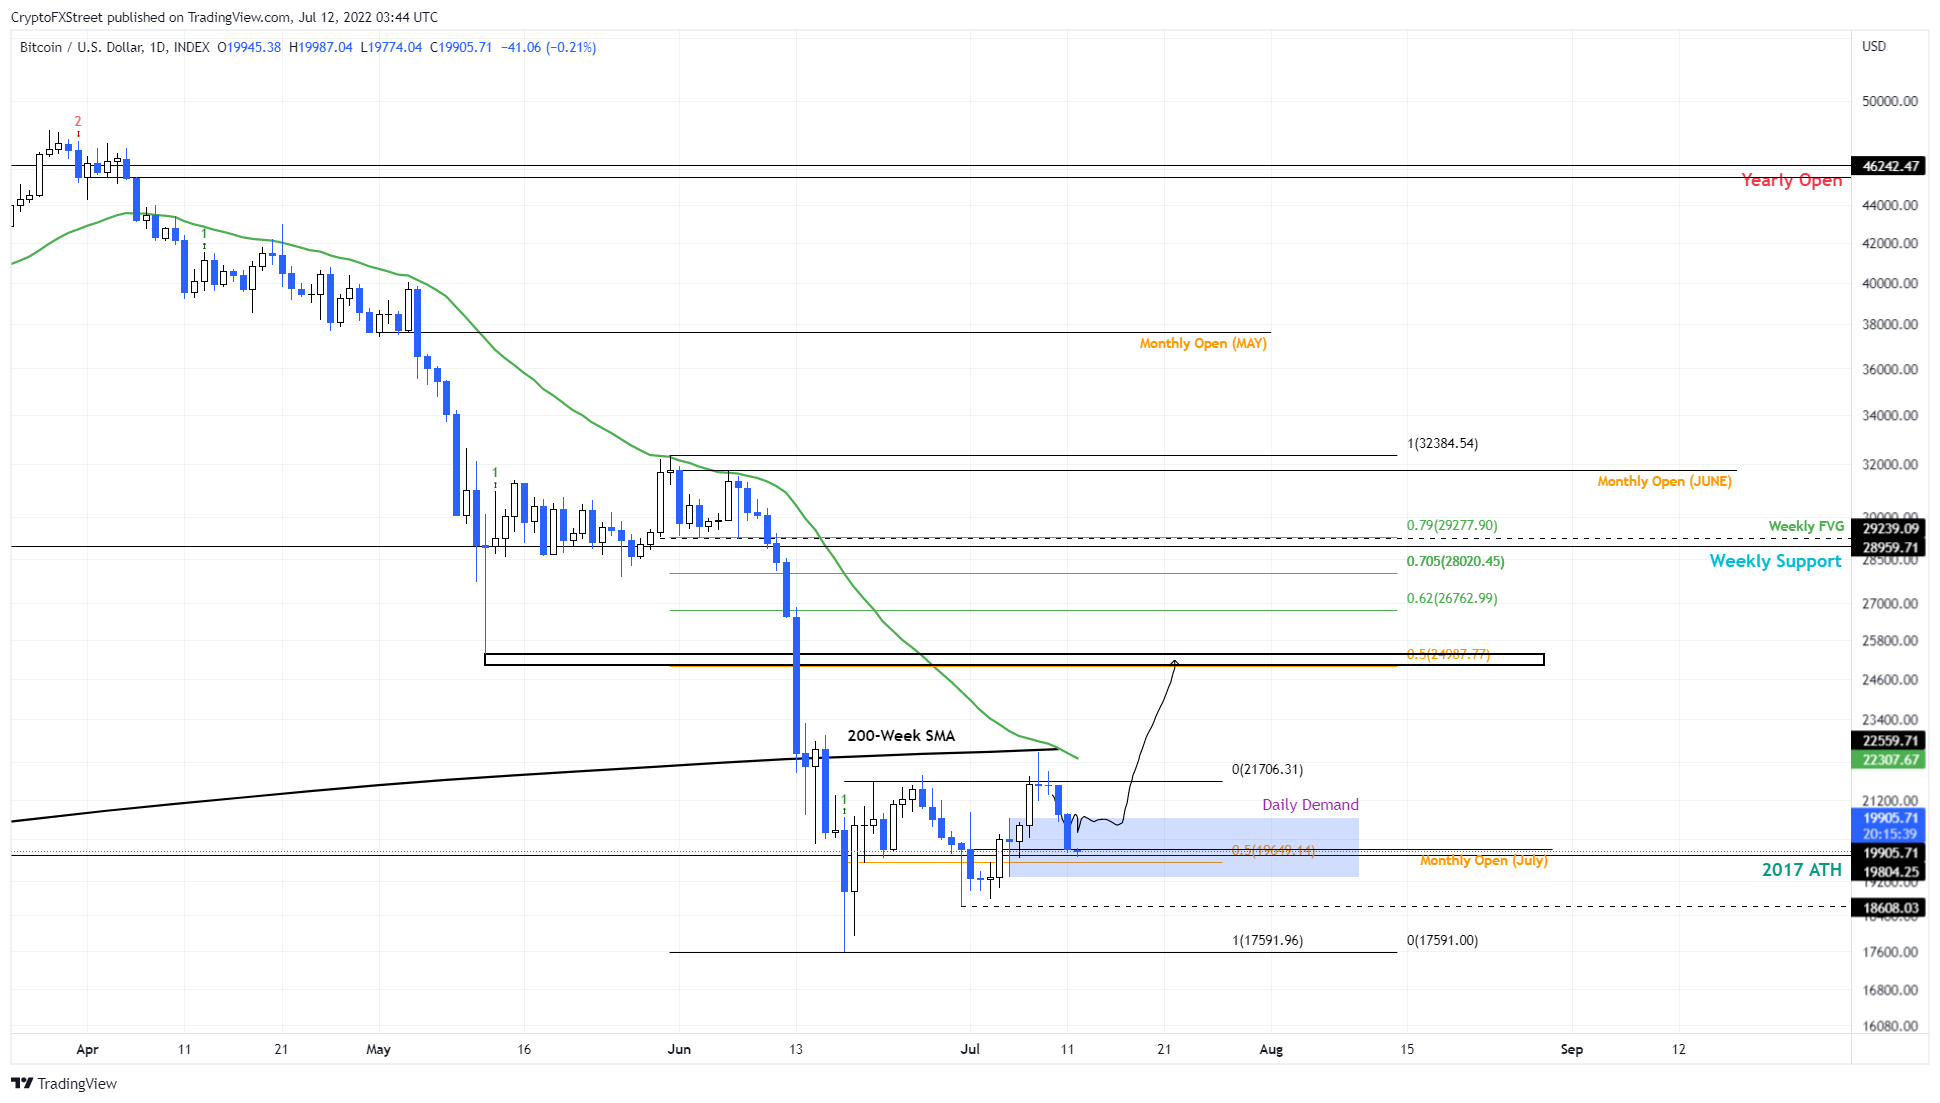
BTC/USD 1-day chart
While the bearish outlook does look more than gloomy, it is possible, at least from a technical standpoint. Further adding credence to this scenario is the talk of Mt. Gox releasing roughly 150,000 BTC.
This flooding could potentially trigger a selling pressure that will push Bitcoin price lower.
However, if Bitcoin price produces a decisive daily candlestick close above the 200-week SMA at $22,559, it will invalidate the bearish thesis. In this case, BTC could trigger a quick run-up that retests the $25,000 hurdle.
Author

Akash Girimath
FXStreet
Akash Girimath is a Mechanical Engineer interested in the chaos of the financial markets. Trying to make sense of this convoluted yet fascinating space, he switched his engineering job to become a crypto reporter and analyst.


