What are the three assets most correlated with Bitcoin?

The financial media often points out Bitcoin’s (BTC $25,995) correlation to Big Tech. “Bitcoin is trading like a tech stock” is a common narrative alongside BTC’s often acute inverse relationship with the United States dollar.
But are these correlations set in stone, and can they help predict future price moves? Let’s look closely at several reports analyzing the relationship between Bitcoin and various asset types.
Bitcoin’s historic correlations vary across timeframes
A report published in October 2022 by the Multidisciplinary Digital Publishing Institute arrived at several key conclusions regarding Bitcoin’s correlations with traditional financial assets, including:
-
The extreme volatility of the Bitcoin market means that long-term correlations are stronger than short-term correlations.
-
The “positive linkage between Bitcoin and risk assets increases during extreme shocks,” such as during COVID-19.
-
Bitcoin can be positively correlated with risk assets and negatively correlated with the U.S. dollar.
-
Bitcoin can serve as a hedge against the U.S. dollar.
While some of these points can be countered with newer price data over the last nine to 10 months, such as a major drop in volatility, insight can still be gained from examining them. In addition, other researchers have gone deeper into the relationship of specific assets to Bitcoin during set timeframes.
Crypto-specific stocks
A few crypto-related equities have been more correlated to Bitcoin than any other assets on the market. The 90-day correlation coefficient for BTC/MSTR, BTC/COIN, and BTC/RIOT have all remained near 1 for the last several months. The symbols “BTC/xxxx” indicate the correlation coefficient for each asset as measured against Bitcoin.
For MicroStrategy (MSTR), the coefficient has fallen no lower than 0.68 since September 2022. The coefficient for Riot Platforms (RIOT) fell to roughly 0.75 in June 2023, while Coinbase (COIN) trended near 0 for a time during May and June.
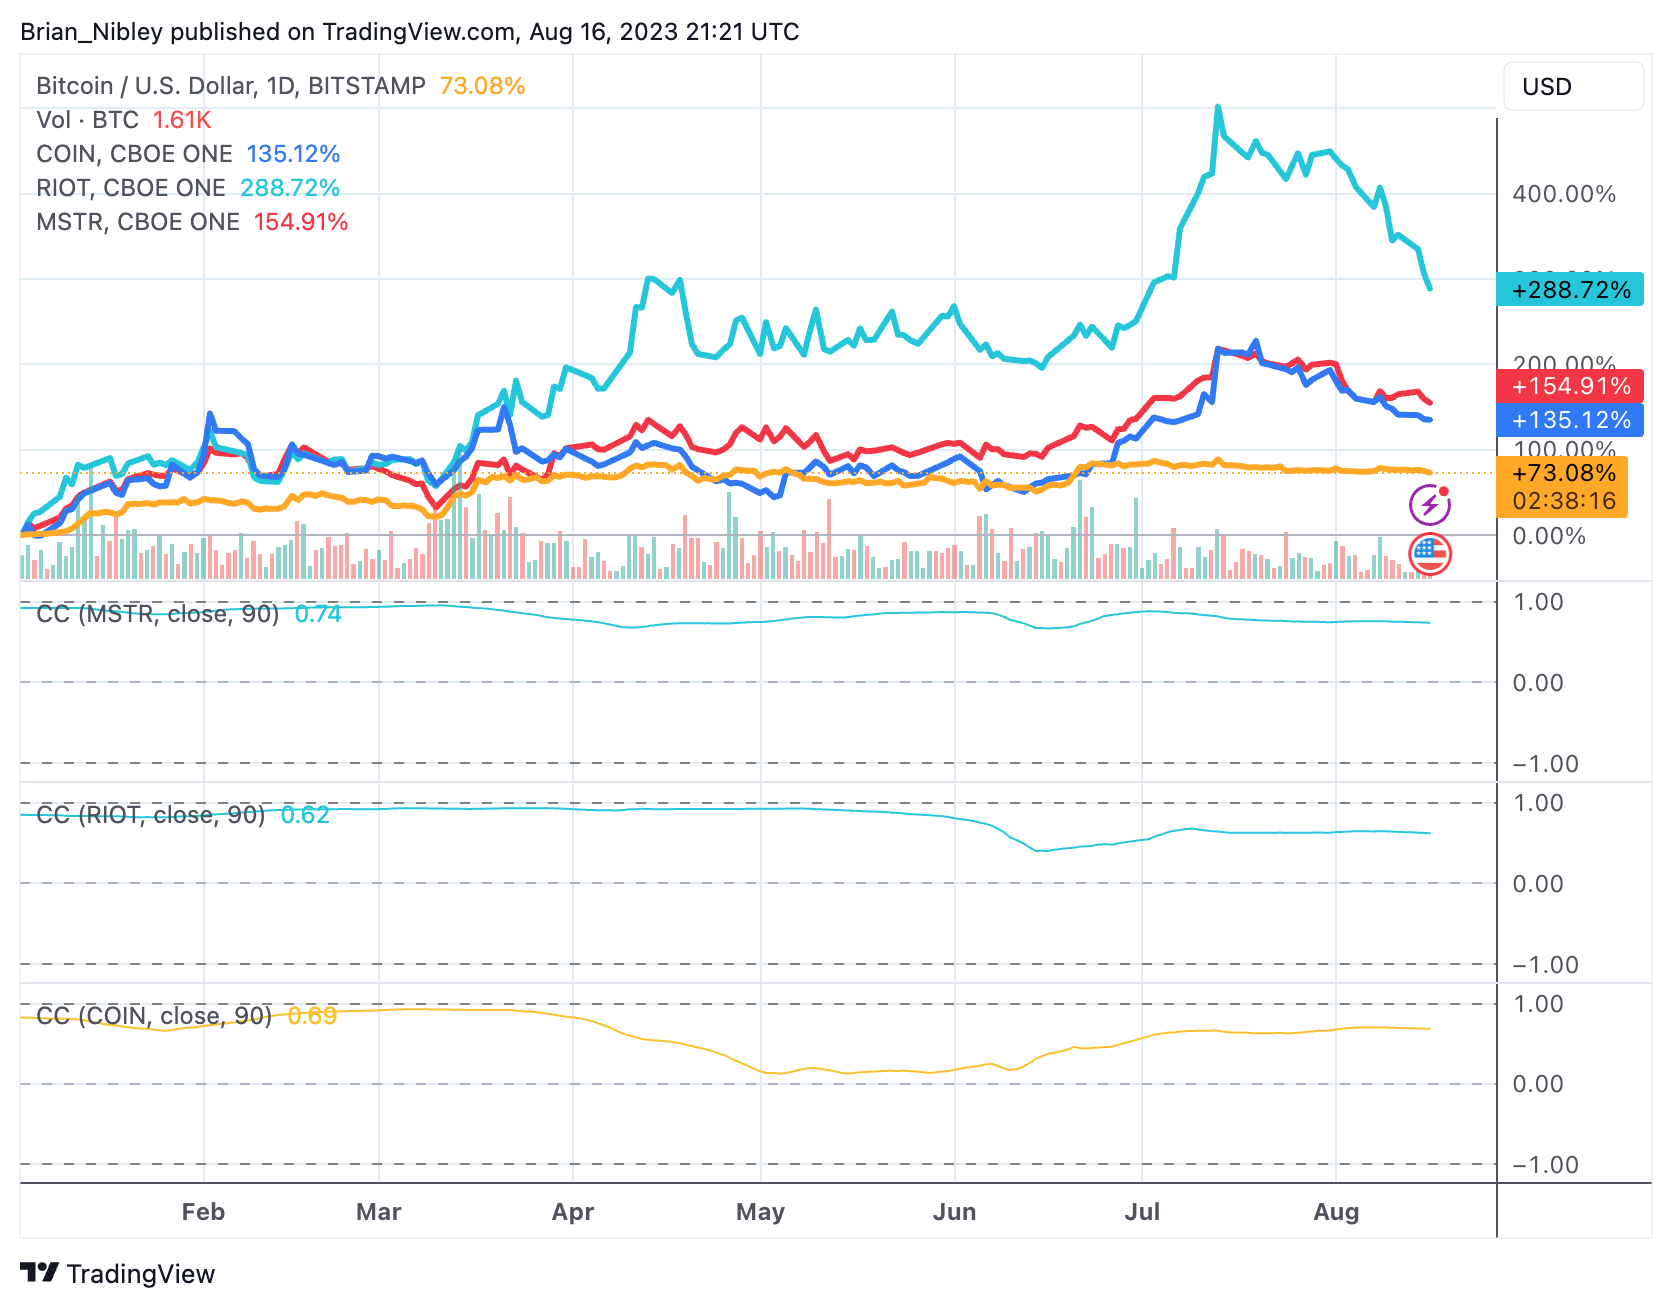
COIN, ROIT and MSTR year-to-date chart with 90-day correlation coefficients compared to BTC. Source: TradingView
All of these stocks have outperformed Bitcoin so far this year while also showing greater volatility. Investors may use these assets as proxies for Bitcoin, which can’t be bought through a brokerage account.
One reason these three stocks are so closely correlated to Bitcoin has to do with the balance sheet of their respective companies. They all have a substantial amount of Bitcoin holdings.
As the table below shows, MicroStrategy has the most holdings of any public company, with 152,333 Bitcoin; Coinbase is fourth, with 10,766 Bitcoin; and Riot is eighth, with 7,094 Bitcoin.
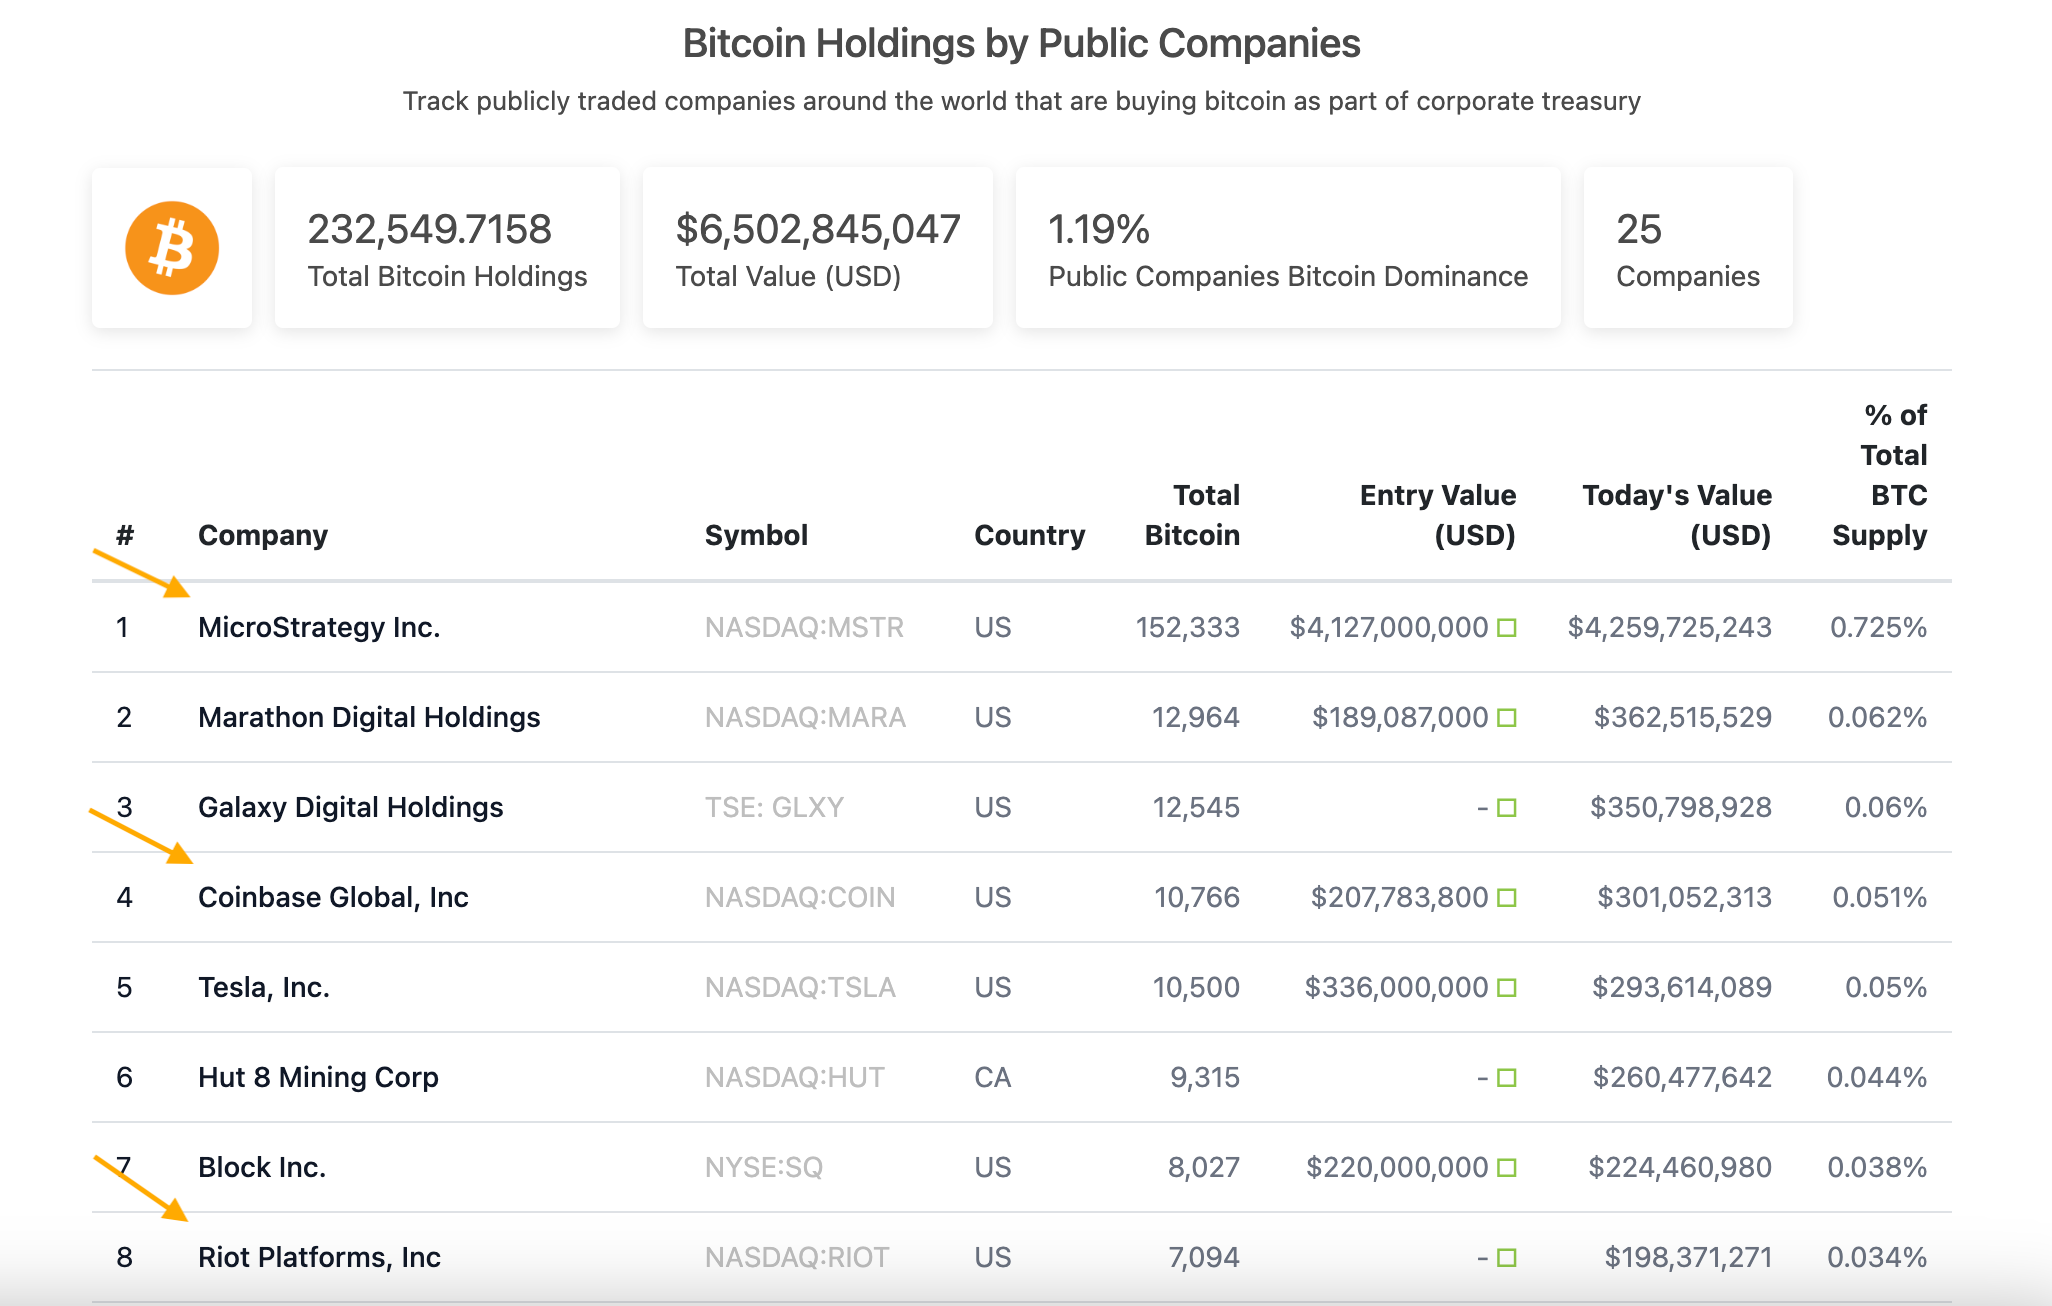
Bitcoin holdings by public companies. Source: CoinGecko
Precious metals
When it comes to correlation with commodities and precious metals, silver beats gold in mirroring Bitcoin’s price moves since 2019.
A November 2022 report by Jordan Doyle and Urav Soni of the CFA Institute titled “How do cryptocurrencies correlate with traditional asset classes?” shed some light on Bitcoin’s most-correlated assets.
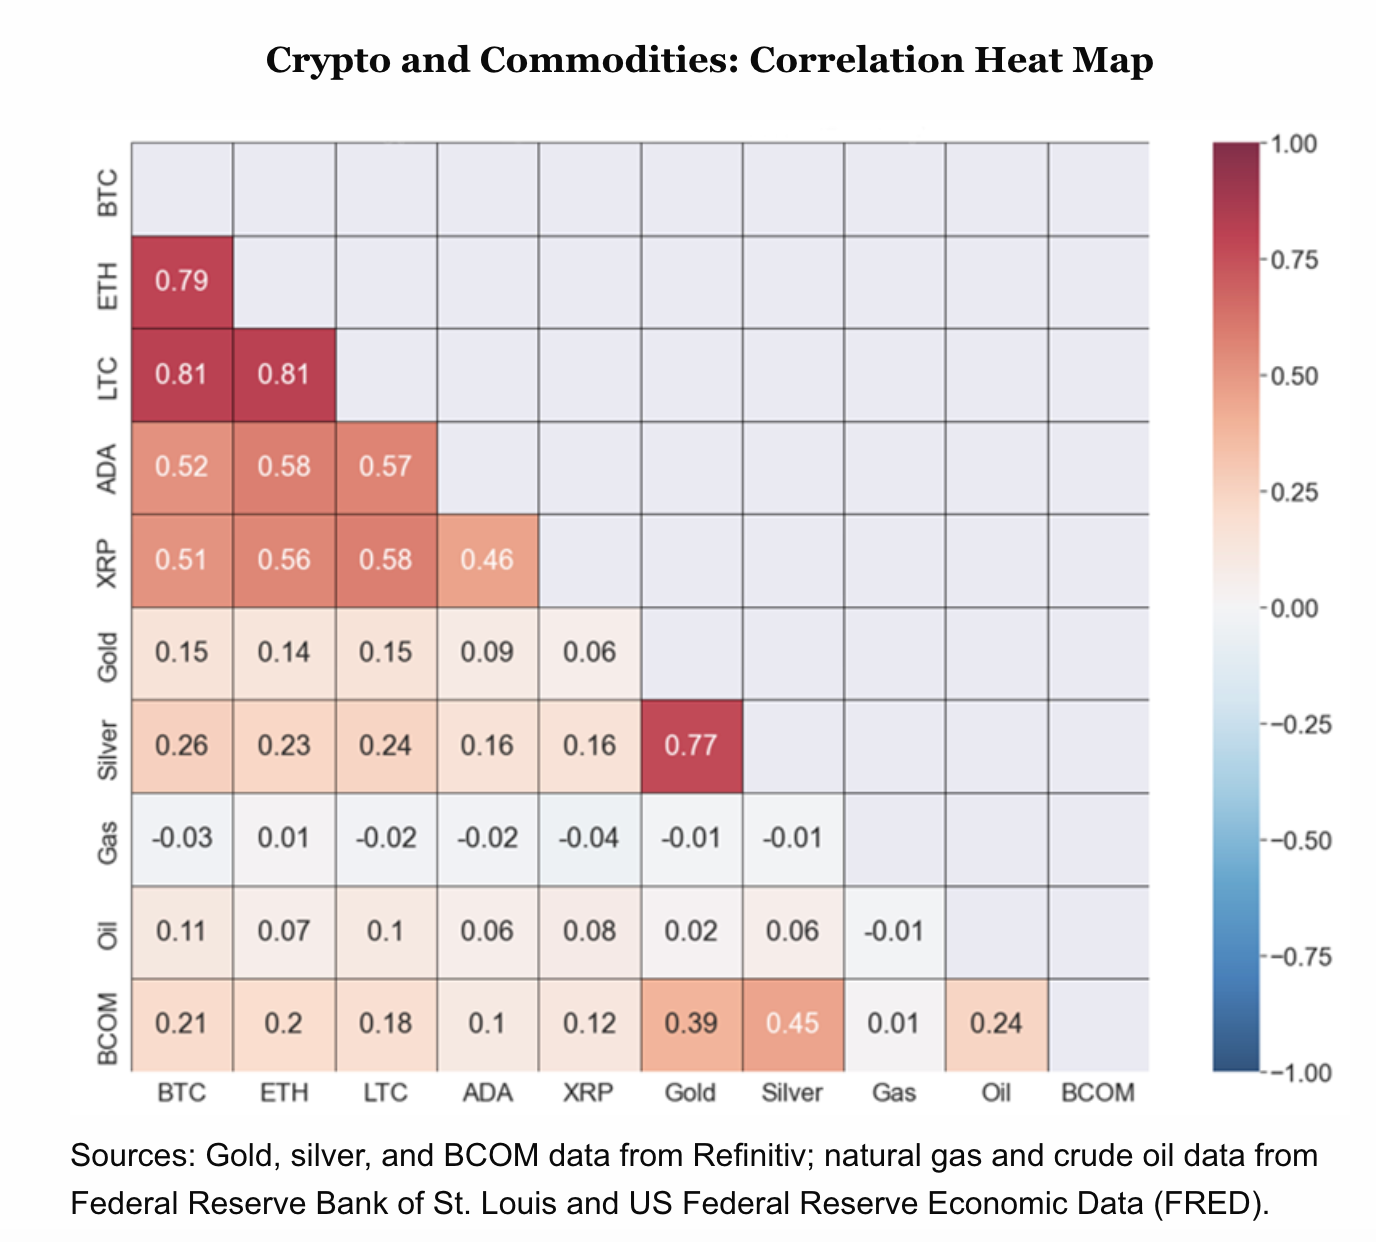
Crypto and commodities correlation heat map. Source: CFA Institute
Silver has been the commodity most closely-correlated to Bitcoin from October 2019 to October 2022, with a correlation coefficient of 0.26, according to the report. Gold’s correlation, by comparison, was just 0.15, perhaps due to silver’s greater volatility.
The report notes:
Silver has the highest correlation, peaking at 0.26 for silver and bitcoin. Bitcoin, the so-called 'digital gold,' exhibits only weak correlation with the precious metal.
Passive and active equity funds and bonds
When speaking of stocks as a whole and their correlation to Bitcoin, looking at an index or exchange-traded fund would be the most common way to make a comparison. This provides an overview of the asset class in general rather than zeroing in on one specific stock, which may have any number of factors affecting it.
As might be expected, growth funds tend to be more correlated with cryptocurrencies, presumably due to their more speculative nature. Notably:
Growth funds exhibit a stronger correlation to cryptocurrencies than value funds. The correlation coefficient between small-cap growth funds and bitcoin, for instance, is 0.41, compared to 0.35 for small-cap value funds and bitcoin.
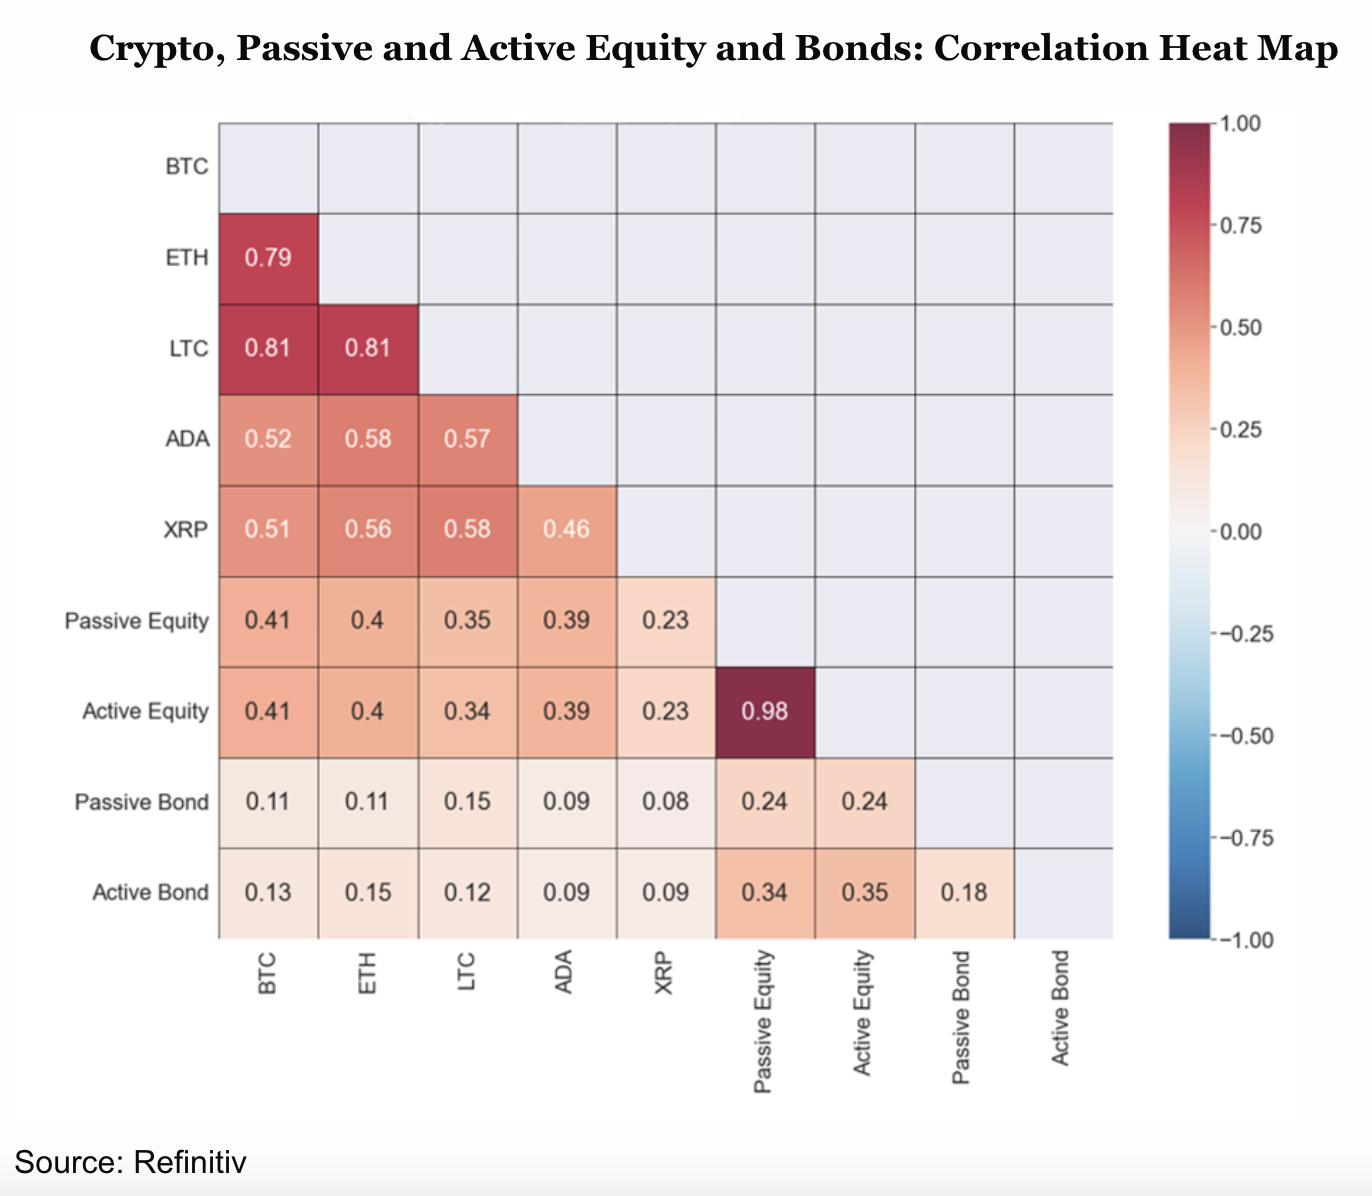
Crypto, equity funds and bonds correlation heat map. Source: CFA Institute
In other words, crypto markets as a whole are “weakly sensitive to interest rate dynamics” that were at least partially responsible for a broad drawdown in equities throughout 2022.
Finally, Bonds bear little to no relationship with Bitcoin. Passive bond funds showed a correlation of just 0.11, while active bond funds were just two basis points higher at 0.13. All data points are for the timeframe of October 2019 to October 2022.
Bitcoin’s correlations are not a crystal ball
Due to Bitcoin’s large price swings, all correlations can change at a moment’s notice. Still, the data used here provides an accurate picture of the assets most closely correlated to Bitcoin in the recent past.
Crypto-specific stocks will likely continue having a strong correlation due to their Bitcoin holdings, while the correlation with commodities and equity funds could quickly change course going forward.
Author

Cointelegraph Team
Cointelegraph
We are privileged enough to work with the best and brightest in Bitcoin.


