Weekly On-chain Report: US tariffs shift sentiment, exchange reserves drop as Bitcoin falls sharply
- Bitcoin drops below $106,000 as expectations for a new all-time high dwindle amid uncertainty over US tariffs.
- Sentiment turns "extremely fearful" as FOMO-driven investors count losses.
- Exchange reserves extend downtrend as holders move assets to long-term storage.
- A drop in the Mean Dollar Invested Age metric suggests older coins are returning to circulation, potentially fueling the next leg up.

The cryptocurrency market is clawing back gains on Friday as Bitcoin (BTC) takes a breather from near all-time-high levels, reflecting mixed sentiment surrounding tariffs in the United States (US).
Market overview: Tariff tensions trigger market swings
The suspension of a 50% tariff on the European Union (EU) until June 9 stabilized Bitcoin earlier this week near the psychological resistance at $110,000, with support around $106,000 becoming apparent.
While global markets digested President Donald Trump's brakes on the EU tariff, the trade war skewed toward the judiciary when a judge ruled on Wednesday that reciprocal tariffs were unlawful. This ruling stated that President Trump overreached his authority and violated the Constitution, which gives Congress the power to set rules governing trade with US partners.
A day later, on Thursday, a federal appeals court stayed the ruling blocking President Trump's tariffs at the request of the Justice Department. The White House welcomed the injunction despite triggering a cascade of sell-offs in global markets, including crypto, whose capitalization is down 4.1% to $3.44 trillion.
Data spotlight: Crowd sentiment shifts as Bitcoin's uptrend falters
Sentiment in the cryptocurrency market has largely had a bullish bias in May, backed by growing institutional interest and specific macroeconomic factors such as easing inflation.
Santiment's data shows how reactive investors have become to news, especially on tariffs. Sentiment also follows price movements, with the highest volume recorded when Bitcoin hit a new all-time high of $111,980.
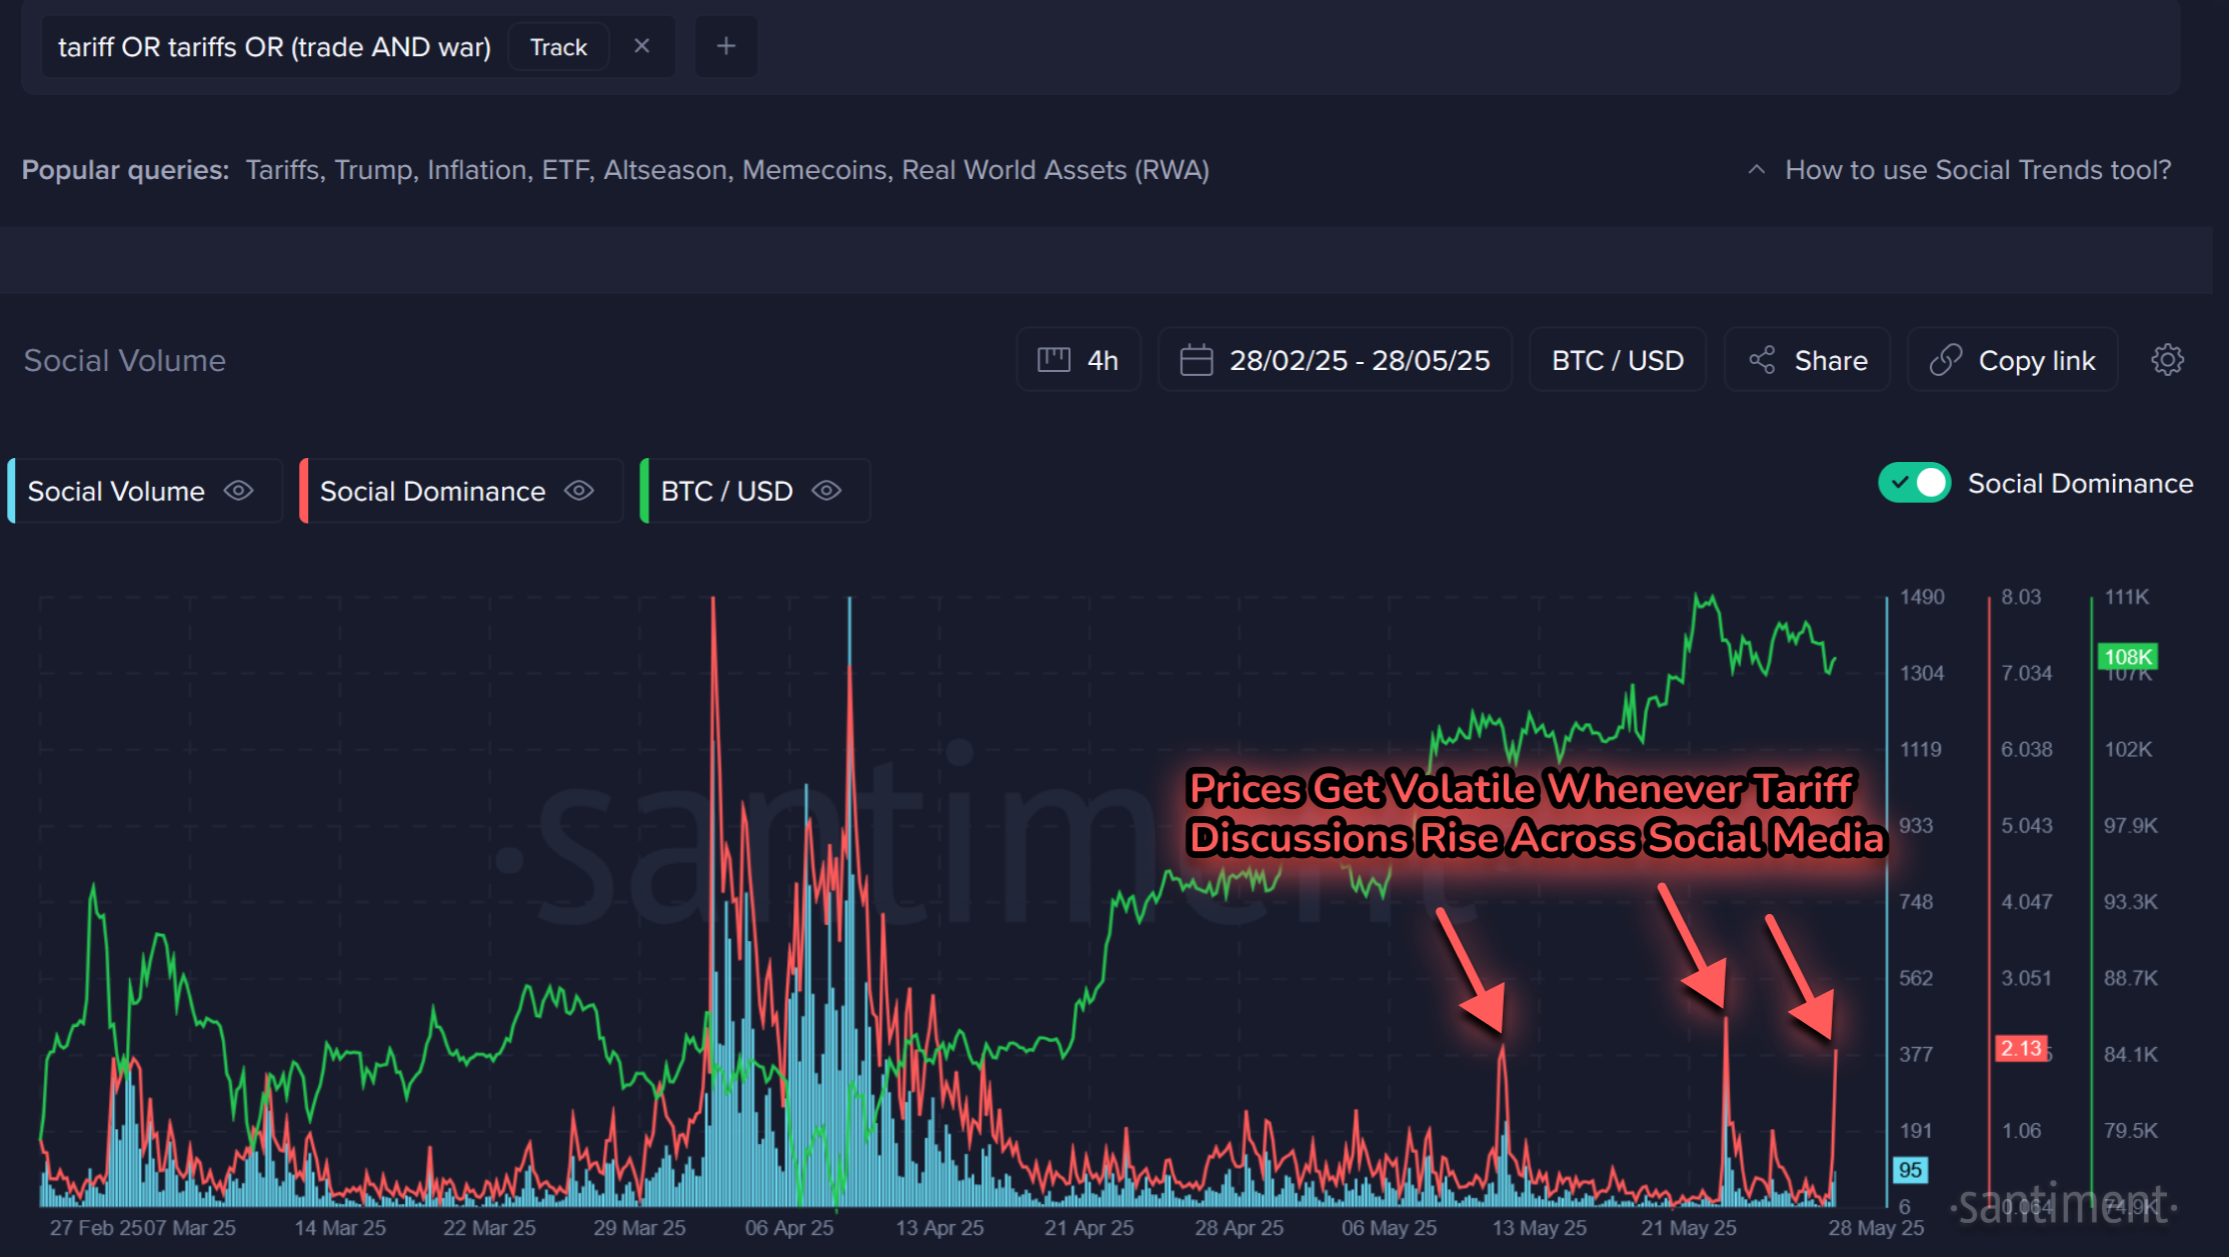
Mentions of tariffs on social media - correlation to Bitcoin | Source: Santiment
Investors who bought into the hype have largely been disadvantaged amid heightened volatility, as illustrated by the chart below. "This moment of "greed" was reflected by a high ratio of bullish (compared to bearish) sentiment, signaling that traders were being overly optimistic," Santiment's latest biweekly report states.
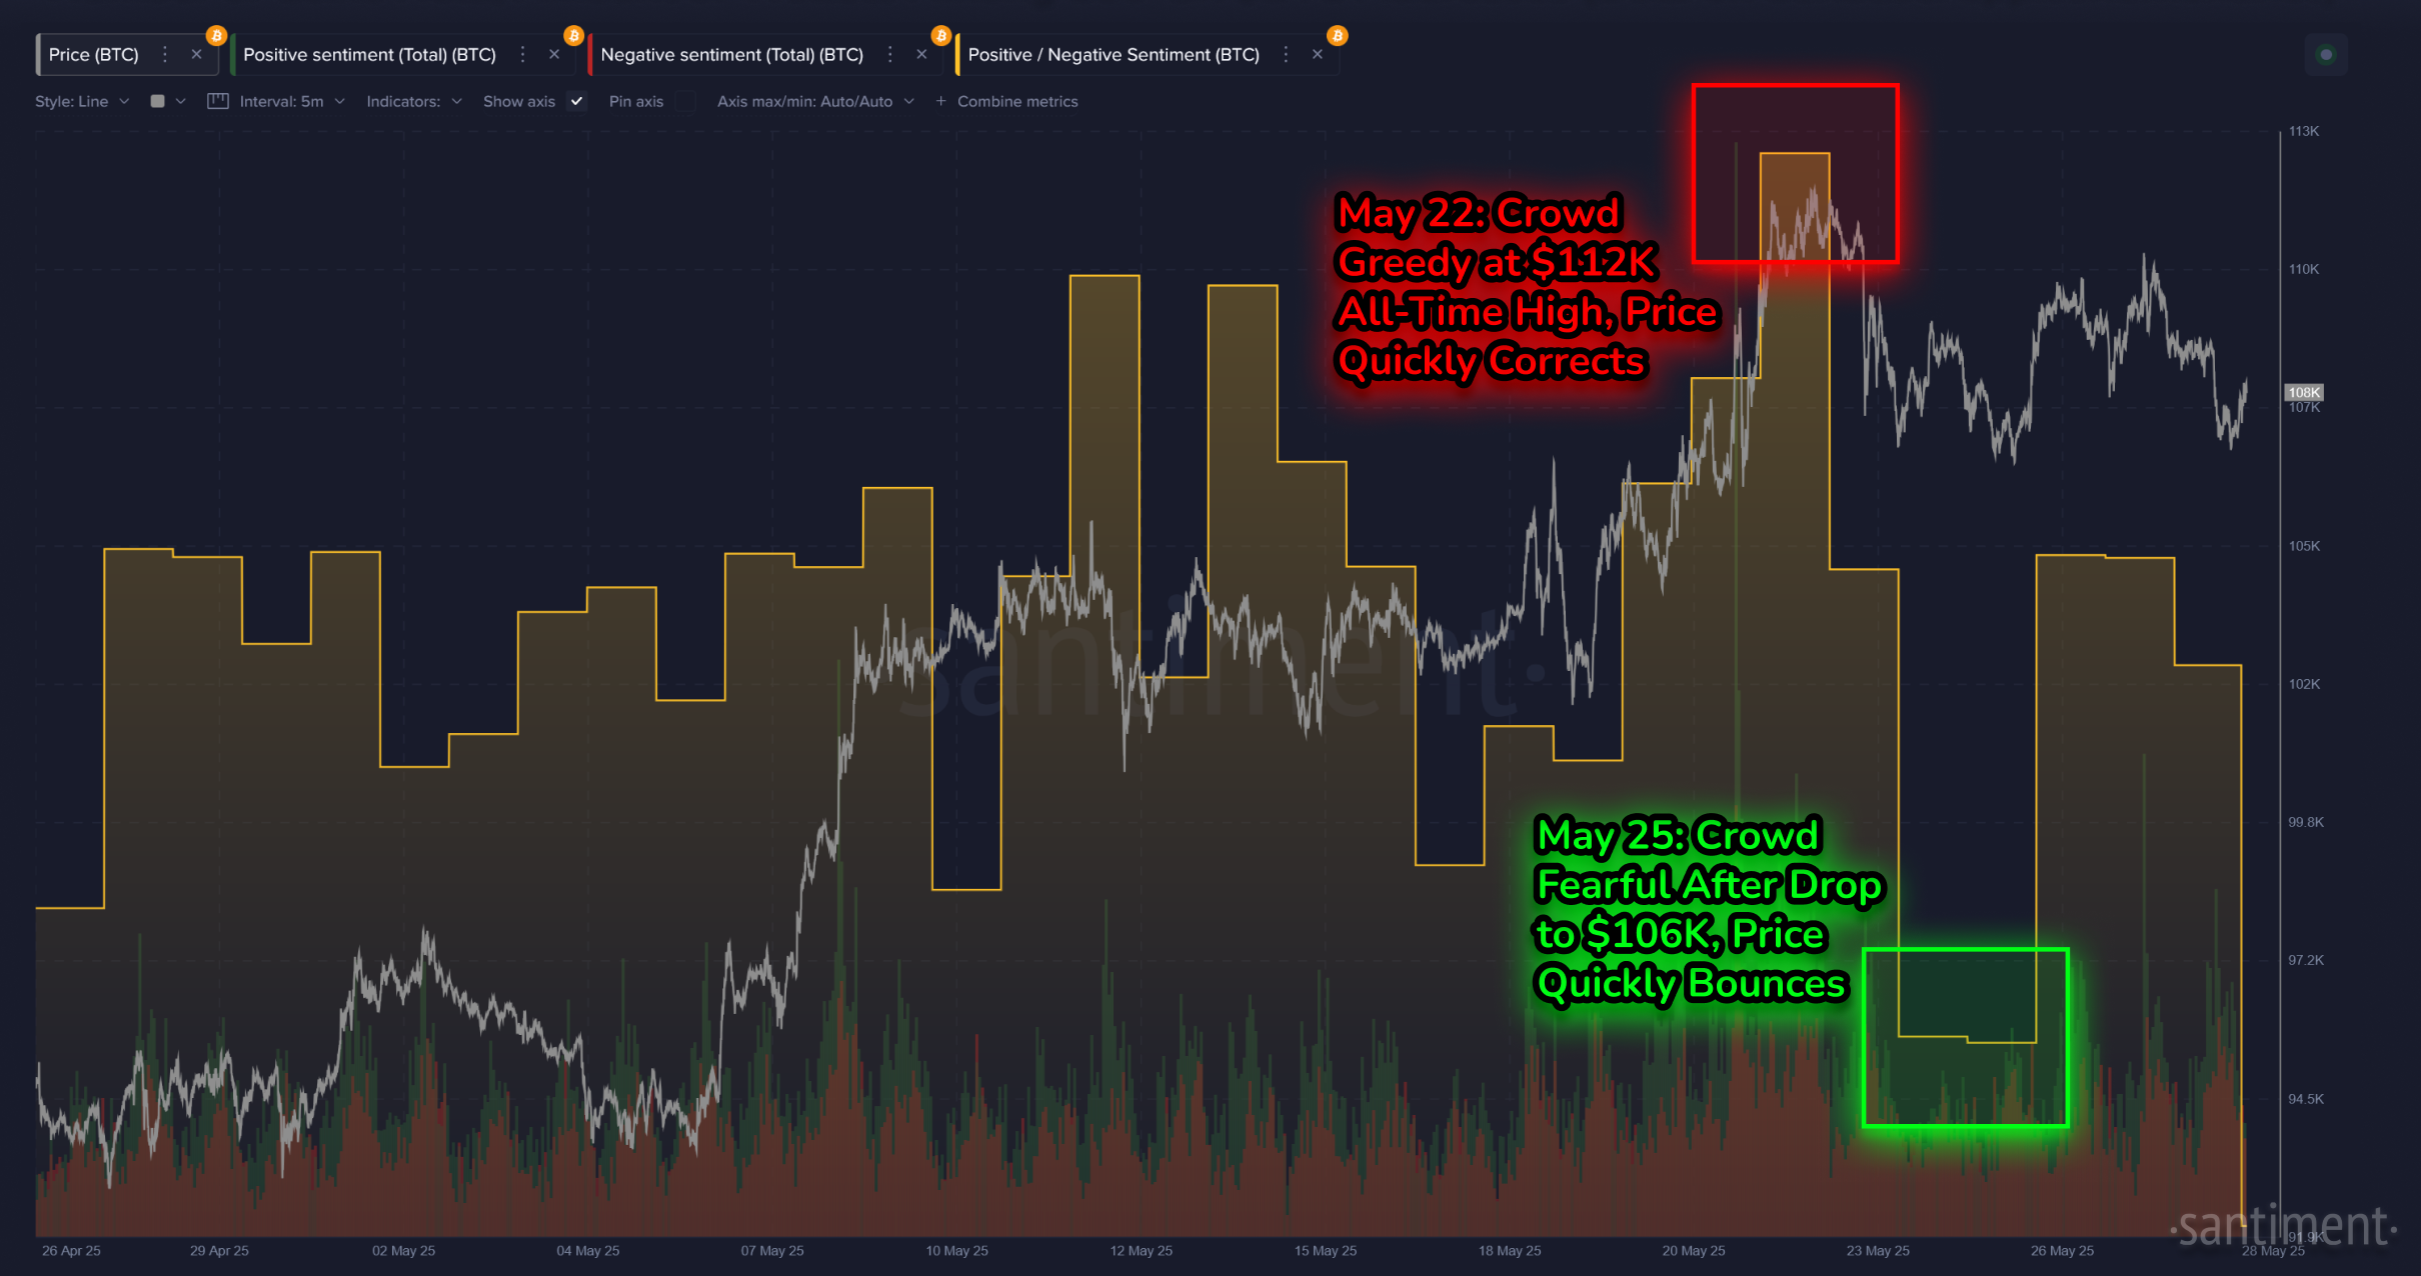
Bitcoin crowd sentiment | Source Santiment
On the bright side, supply continues to leave exchanges, signaling potential bullish momentum. According to CryptoQuant data, the balance of BTC on exchanges currently stands at 2.4 million, down from 2.7 million coins as of January 1.
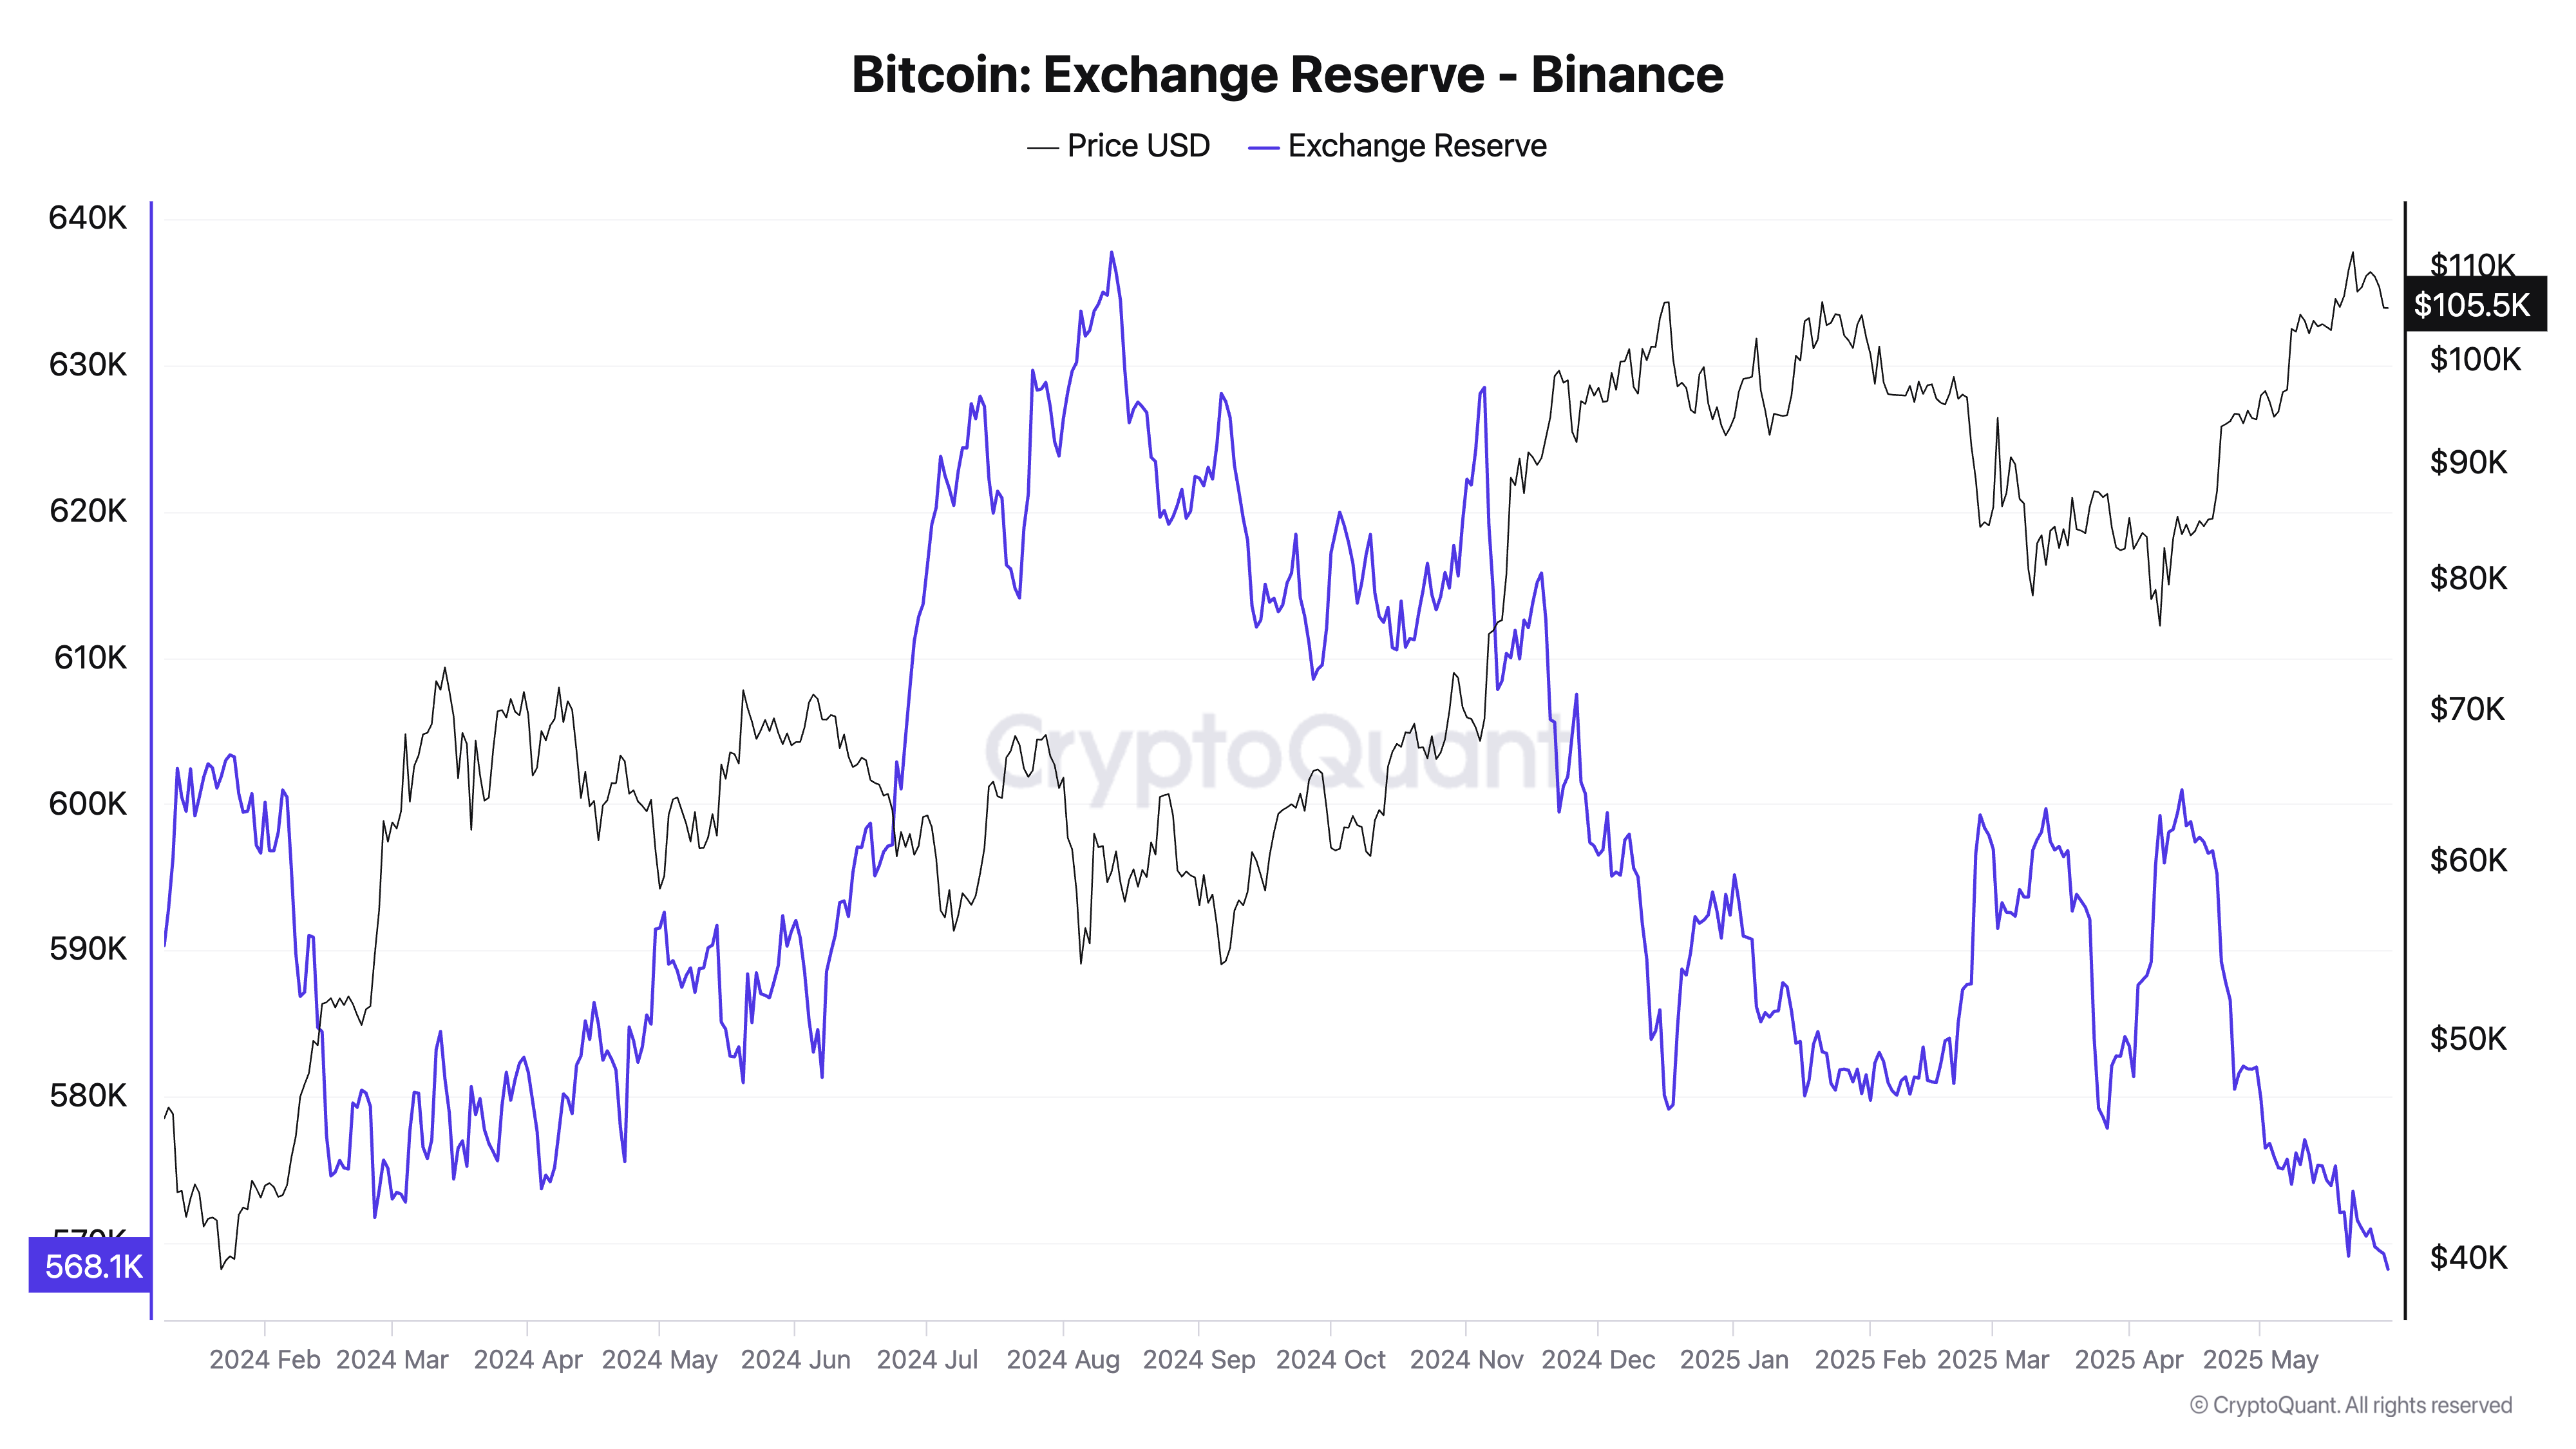
Bitcoin's exchange reserves | Source: CryptoQuant
The downtrend in exchange reserves dates back to the time interest rate hikes ceased in 2022, according to Santiment's analysis. When holders move assets from exchanges to long-term storage, it signals confidence in future performance, consequently bringing down the likelihood of immediate sell-side pressure and increasing the potential for long-term price increases.
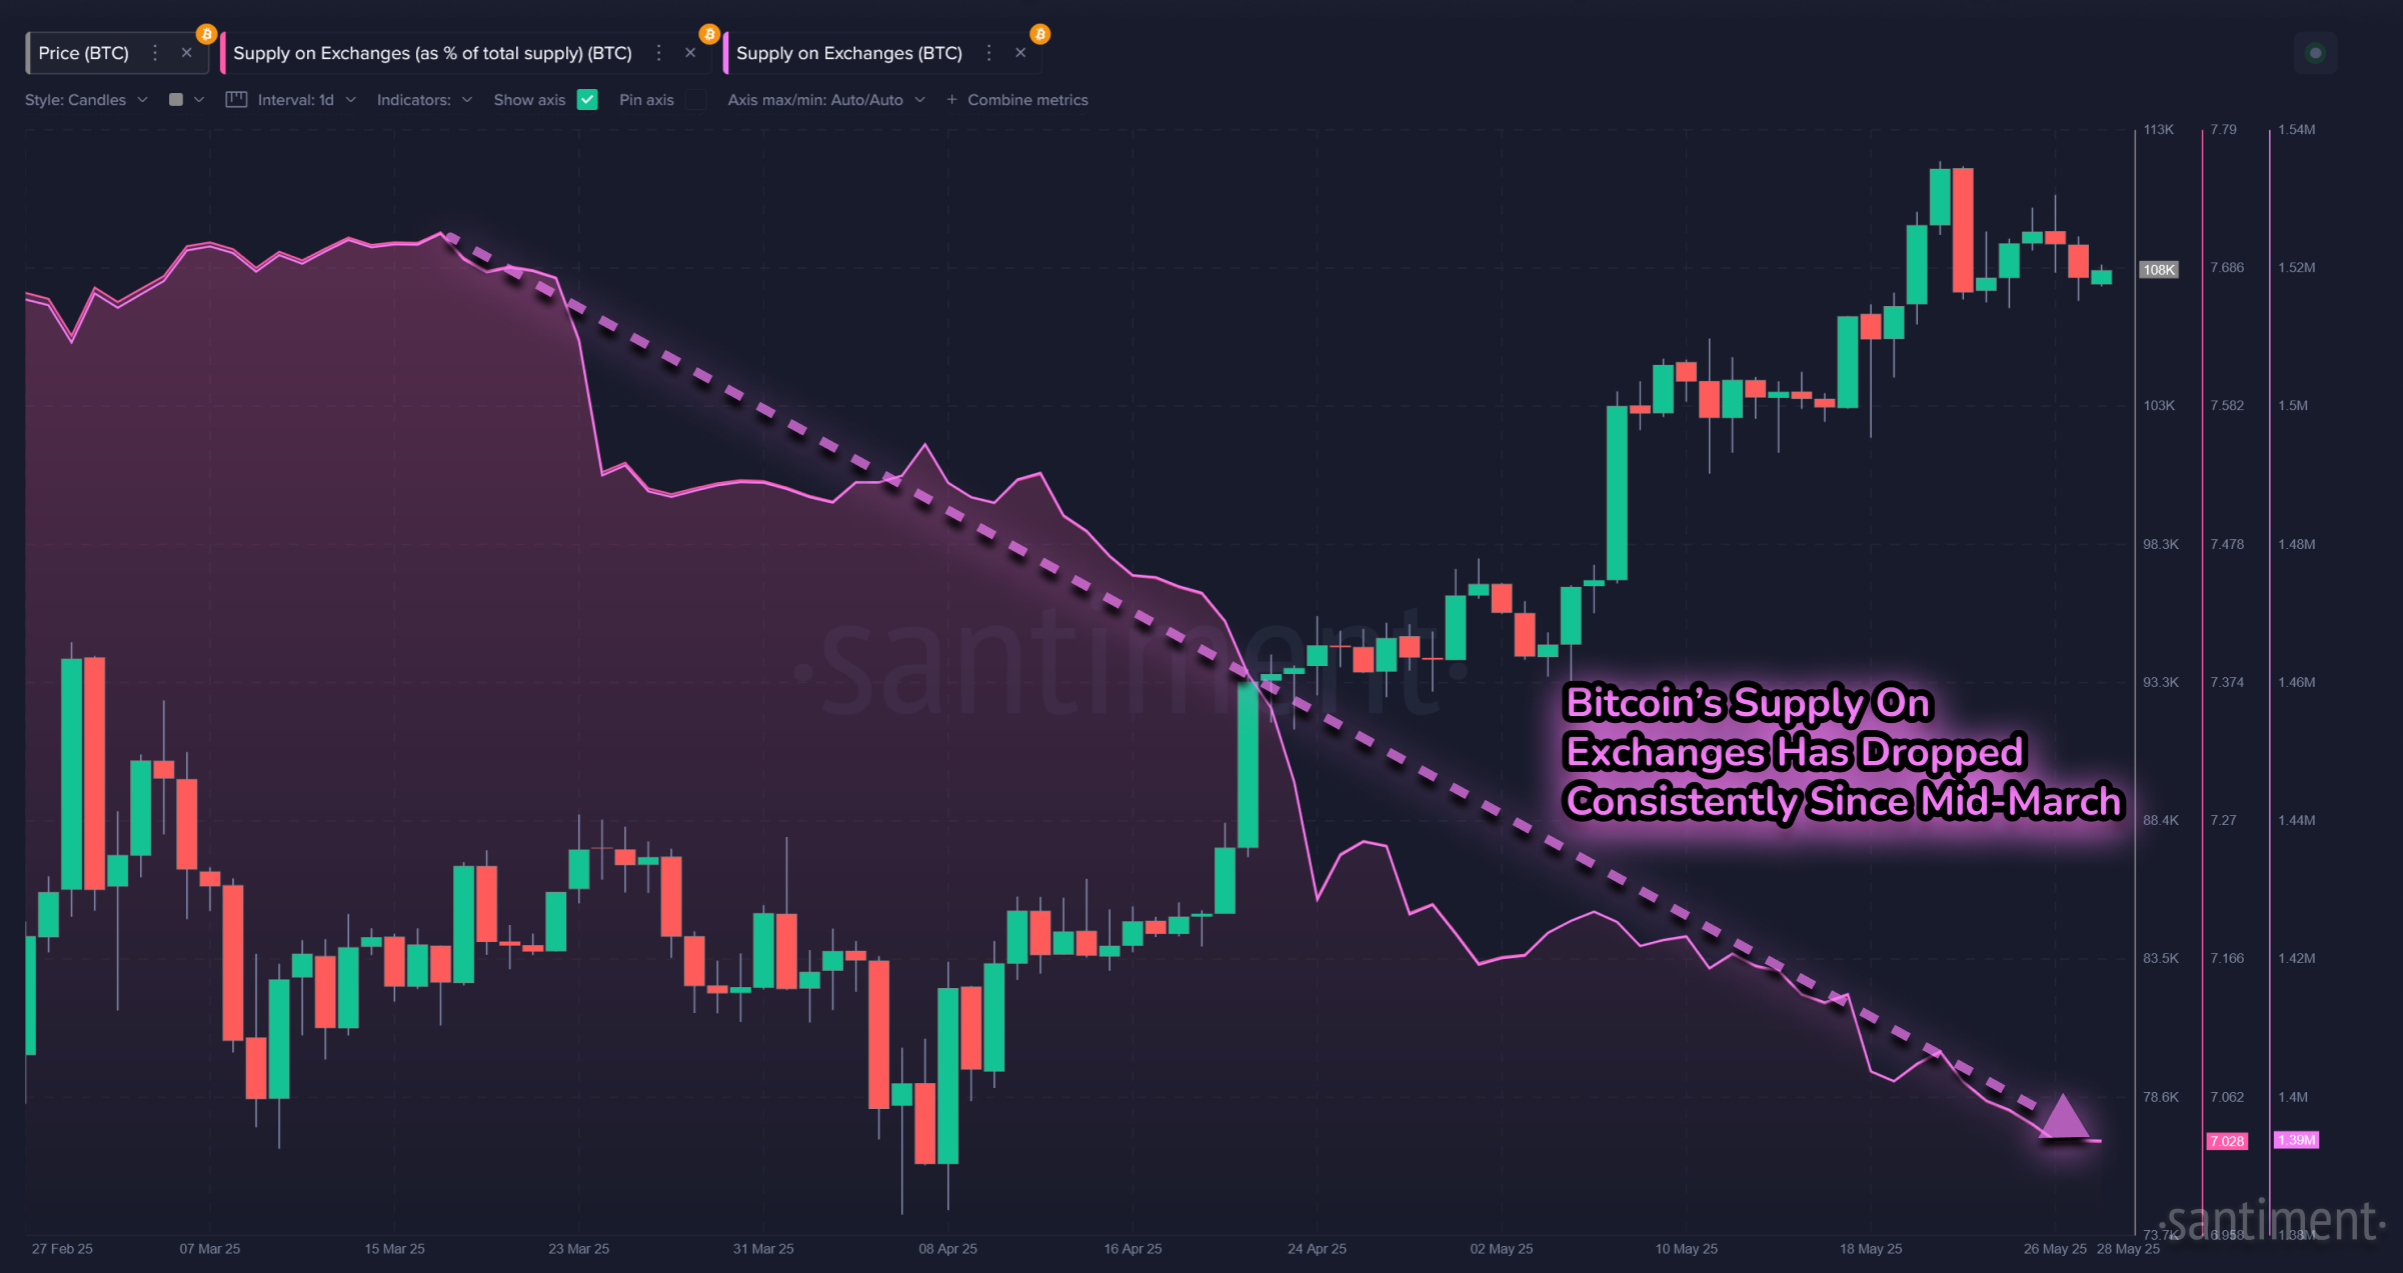
Bitcoin's supply and exchange reserves | Source: Santiment
The Mean Dollar Invested Age (MDIA) metric, which tracks the average duration that coins remain in wallets without being moved, has sustained an extended downtrend since mid-April, when tariff tensions began to cool off, paving the way for negotiations.
"A falling line indicates that old coins are being brought back into circulation, allowing utility to rise and an asset's network to grow and flourish," Santiment explains in the report.
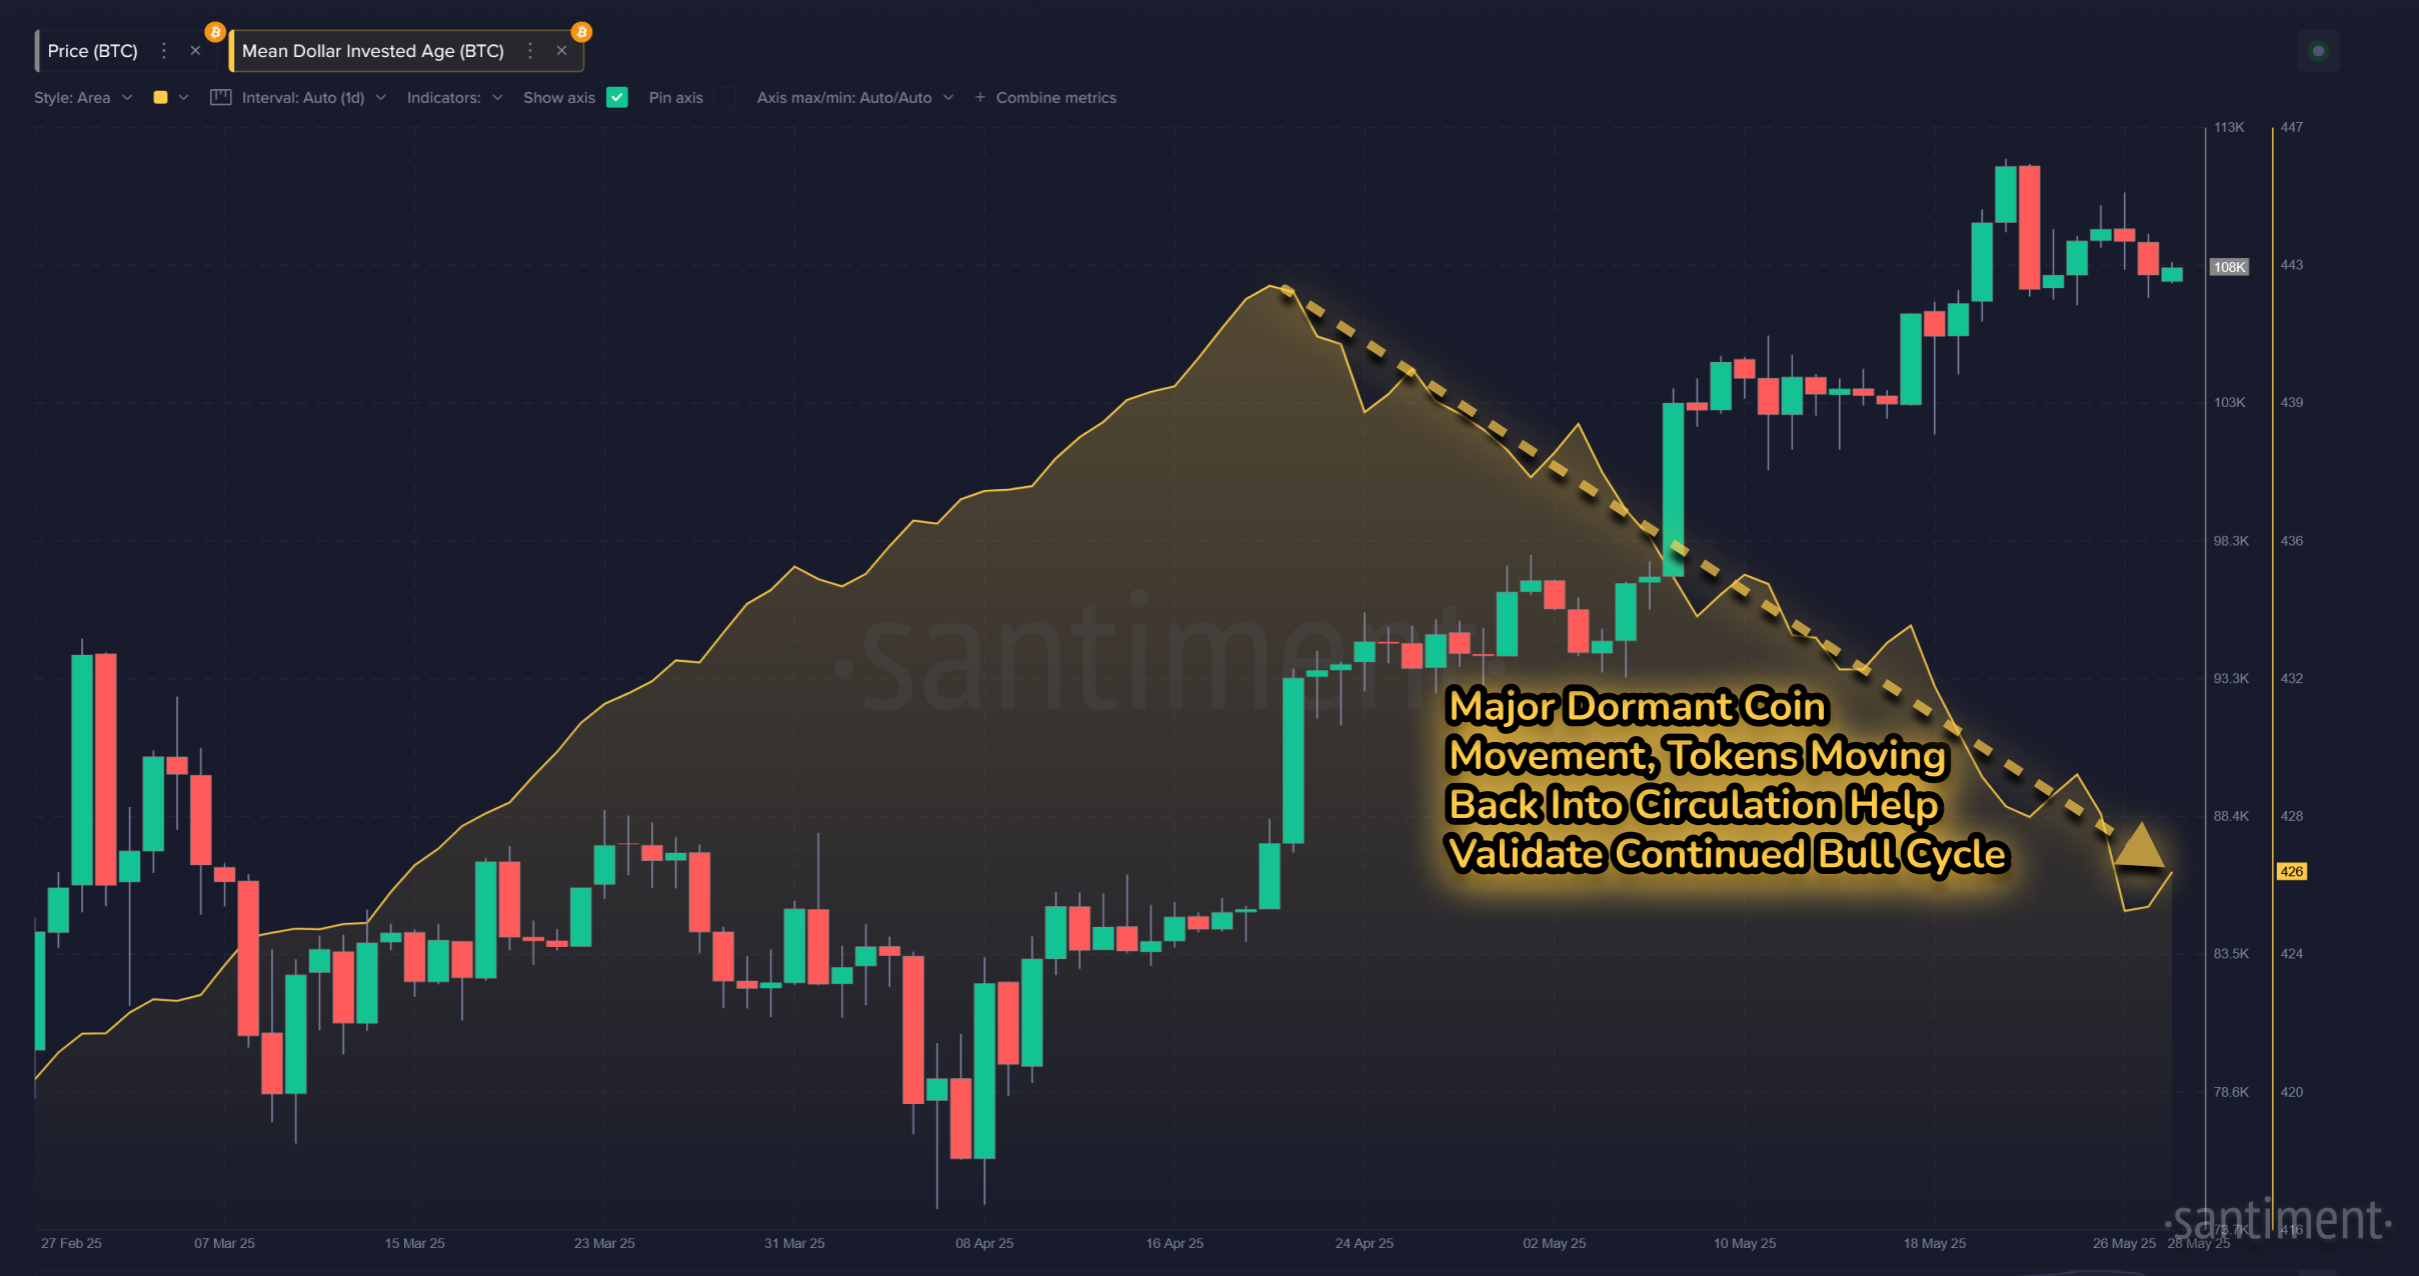
Bitcoin's MDIA metric | Source: Santiment
Bitcoin's technical outlook remains bearish during the American session on Friday, trading at around $104,243. Key indicators such as the Moving Average Convergence Divergence (MACD) reinforce the bearish momentum as it slopes toward the zero line (0.00). Traders are likely to continue reducing their exposure to BTC as the Relative Strength Index (RSI) downtrend extends below the 50 midline.
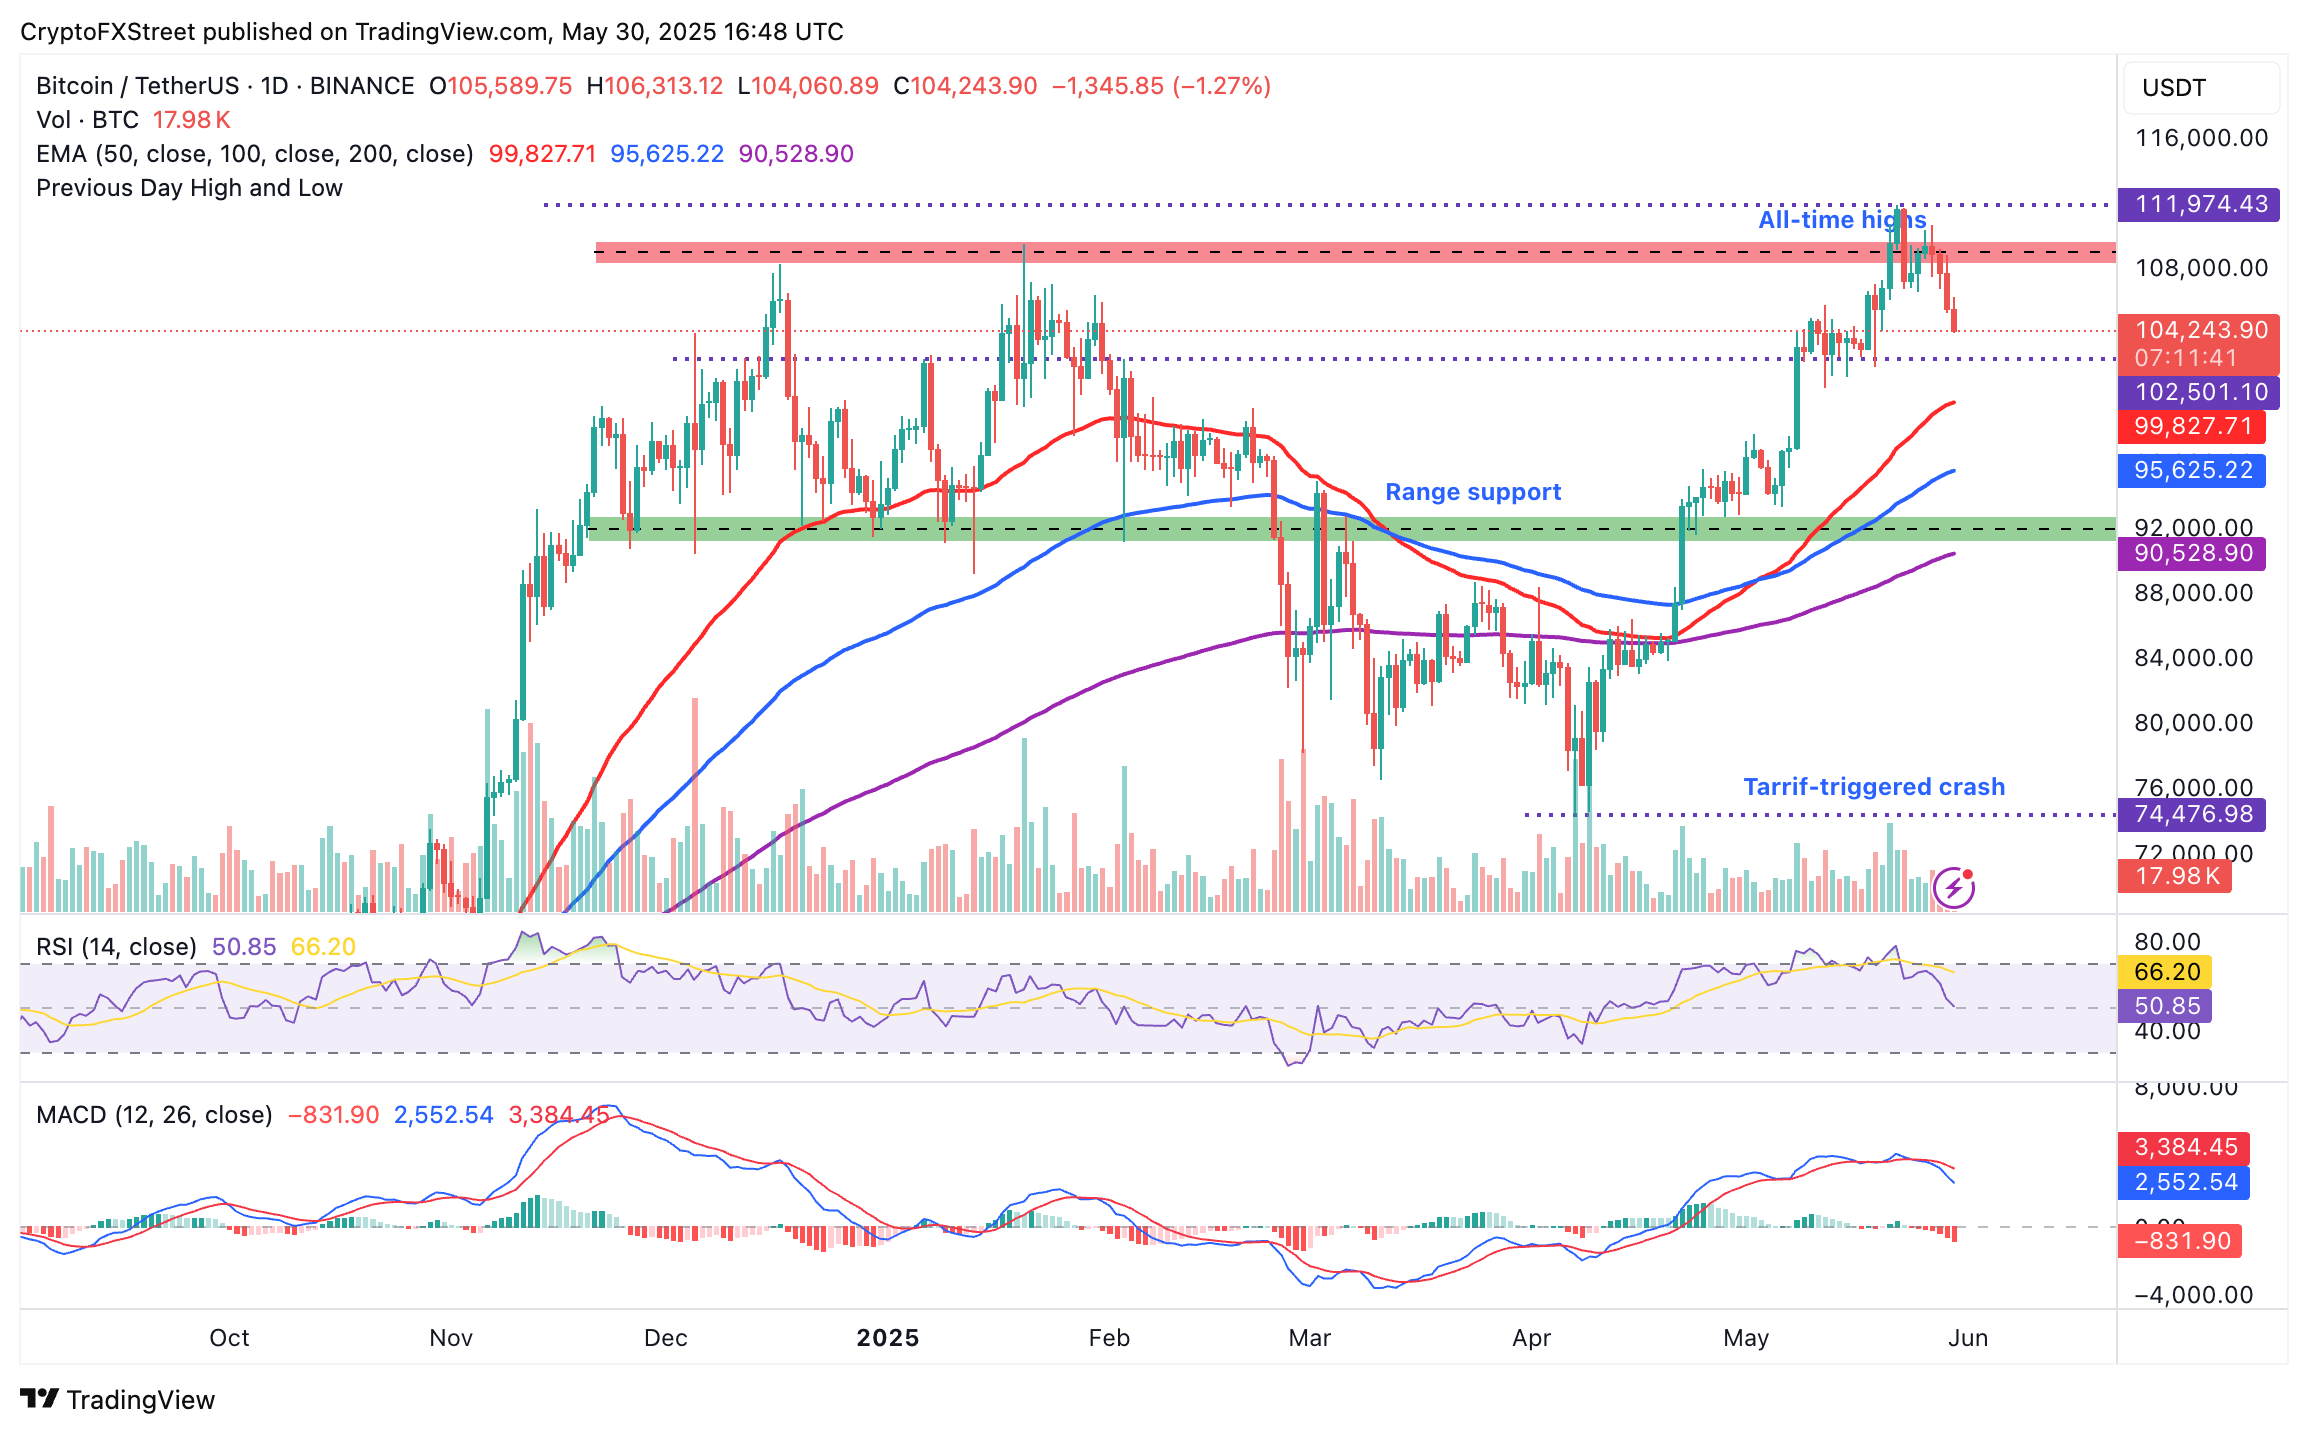
BTC/USDT daily chart
Key levels of interest include the region around $102,500, which was tested as support in mid-May. The 50-day Exponential Moving Average (EMA) and the 100-day EMA are poised to provide support at $99,810 and $95,617, respectively, if losses intensify in the upcoming sessions.
Cryptocurrency metrics FAQs
The developer or creator of each cryptocurrency decides on the total number of tokens that can be minted or issued. Only a certain number of these assets can be minted by mining, staking or other mechanisms. This is defined by the algorithm of the underlying blockchain technology. On the other hand, circulating supply can also be decreased via actions such as burning tokens, or mistakenly sending assets to addresses of other incompatible blockchains.
Market capitalization is the result of multiplying the circulating supply of a certain asset by the asset’s current market value.
Trading volume refers to the total number of tokens for a specific asset that has been transacted or exchanged between buyers and sellers within set trading hours, for example, 24 hours. It is used to gauge market sentiment, this metric combines all volumes on centralized exchanges and decentralized exchanges. Increasing trading volume often denotes the demand for a certain asset as more people are buying and selling the cryptocurrency.
Funding rates are a concept designed to encourage traders to take positions and ensure perpetual contract prices match spot markets. It defines a mechanism by exchanges to ensure that future prices and index prices periodic payments regularly converge. When the funding rate is positive, the price of the perpetual contract is higher than the mark price. This means traders who are bullish and have opened long positions pay traders who are in short positions. On the other hand, a negative funding rate means perpetual prices are below the mark price, and hence traders with short positions pay traders who have opened long positions.
Author

John Isige
FXStreet
John Isige is a seasoned cryptocurrency journalist and markets analyst committed to delivering high-quality, actionable insights tailored to traders, investors, and crypto enthusiasts. He enjoys deep dives into emerging Web3 tren


