Veteran analyst expects large gains in SOL and XRP, seeks followers' advice to choose one
- Peter Brandt, a veteran chartist, shares bullish charts on Solana and XRP, projecting significant gains for both.
- Solana trades at $177, with mild intraday gains of under 1% on Monday, while an analyst targets $518 with a cup-and-handle breakout.
- XRP trades at $2.34 as it nears the apex of a triangle pattern; the analyst targets $4.43 with a bullish extension.

Peter Brandt, a veteran futures market chart trader since 1975, anticipates bold gains in top altcoins: Solana (SOL) and Ripple’s XRP, as he opens the floor to his X followers, seeking advice on which altcoin to choose for a $100K investment.
Solana and XRP rank amongst the top 10 cryptocurrencies with market caps of $137 billion and $92 billion, respectively. Ripple’s XRP token records a 12.34% year-to-date gain while Solana is down by over 7%. However, over the last 90 days, Solana shines with a 25% rally while XRP’s growth is limited to 1.46%.
Solana nears rounding bottom breakout
Solana at $177 is up 20% this month, at press time, following the 18% reversal in April. With the recovery price action forming a U-shape, a rounding bottom pattern emerges with a neckline near the $180 supply zone.
Based on the Fibonacci levels extending between $261 and $105 from January 18 to April 8, the neckline is close to the 50% level at $183. Hence, a potential daily closing above $183 could start the next bull run in Solana. The pattern’s breakout target is calculated by adding the depth to the breakout point, targeting $257 near the 78.6% Fibonacci level at $262.
The 50-day and 100-day EMAs give a bullish crossover supporting trend reversal chances. However, the momentum indicators showcase untapped potential as RSI hovers flat at 60 while the MACD and its signal line run parallel at close proximity, teasing a bullish crossover.
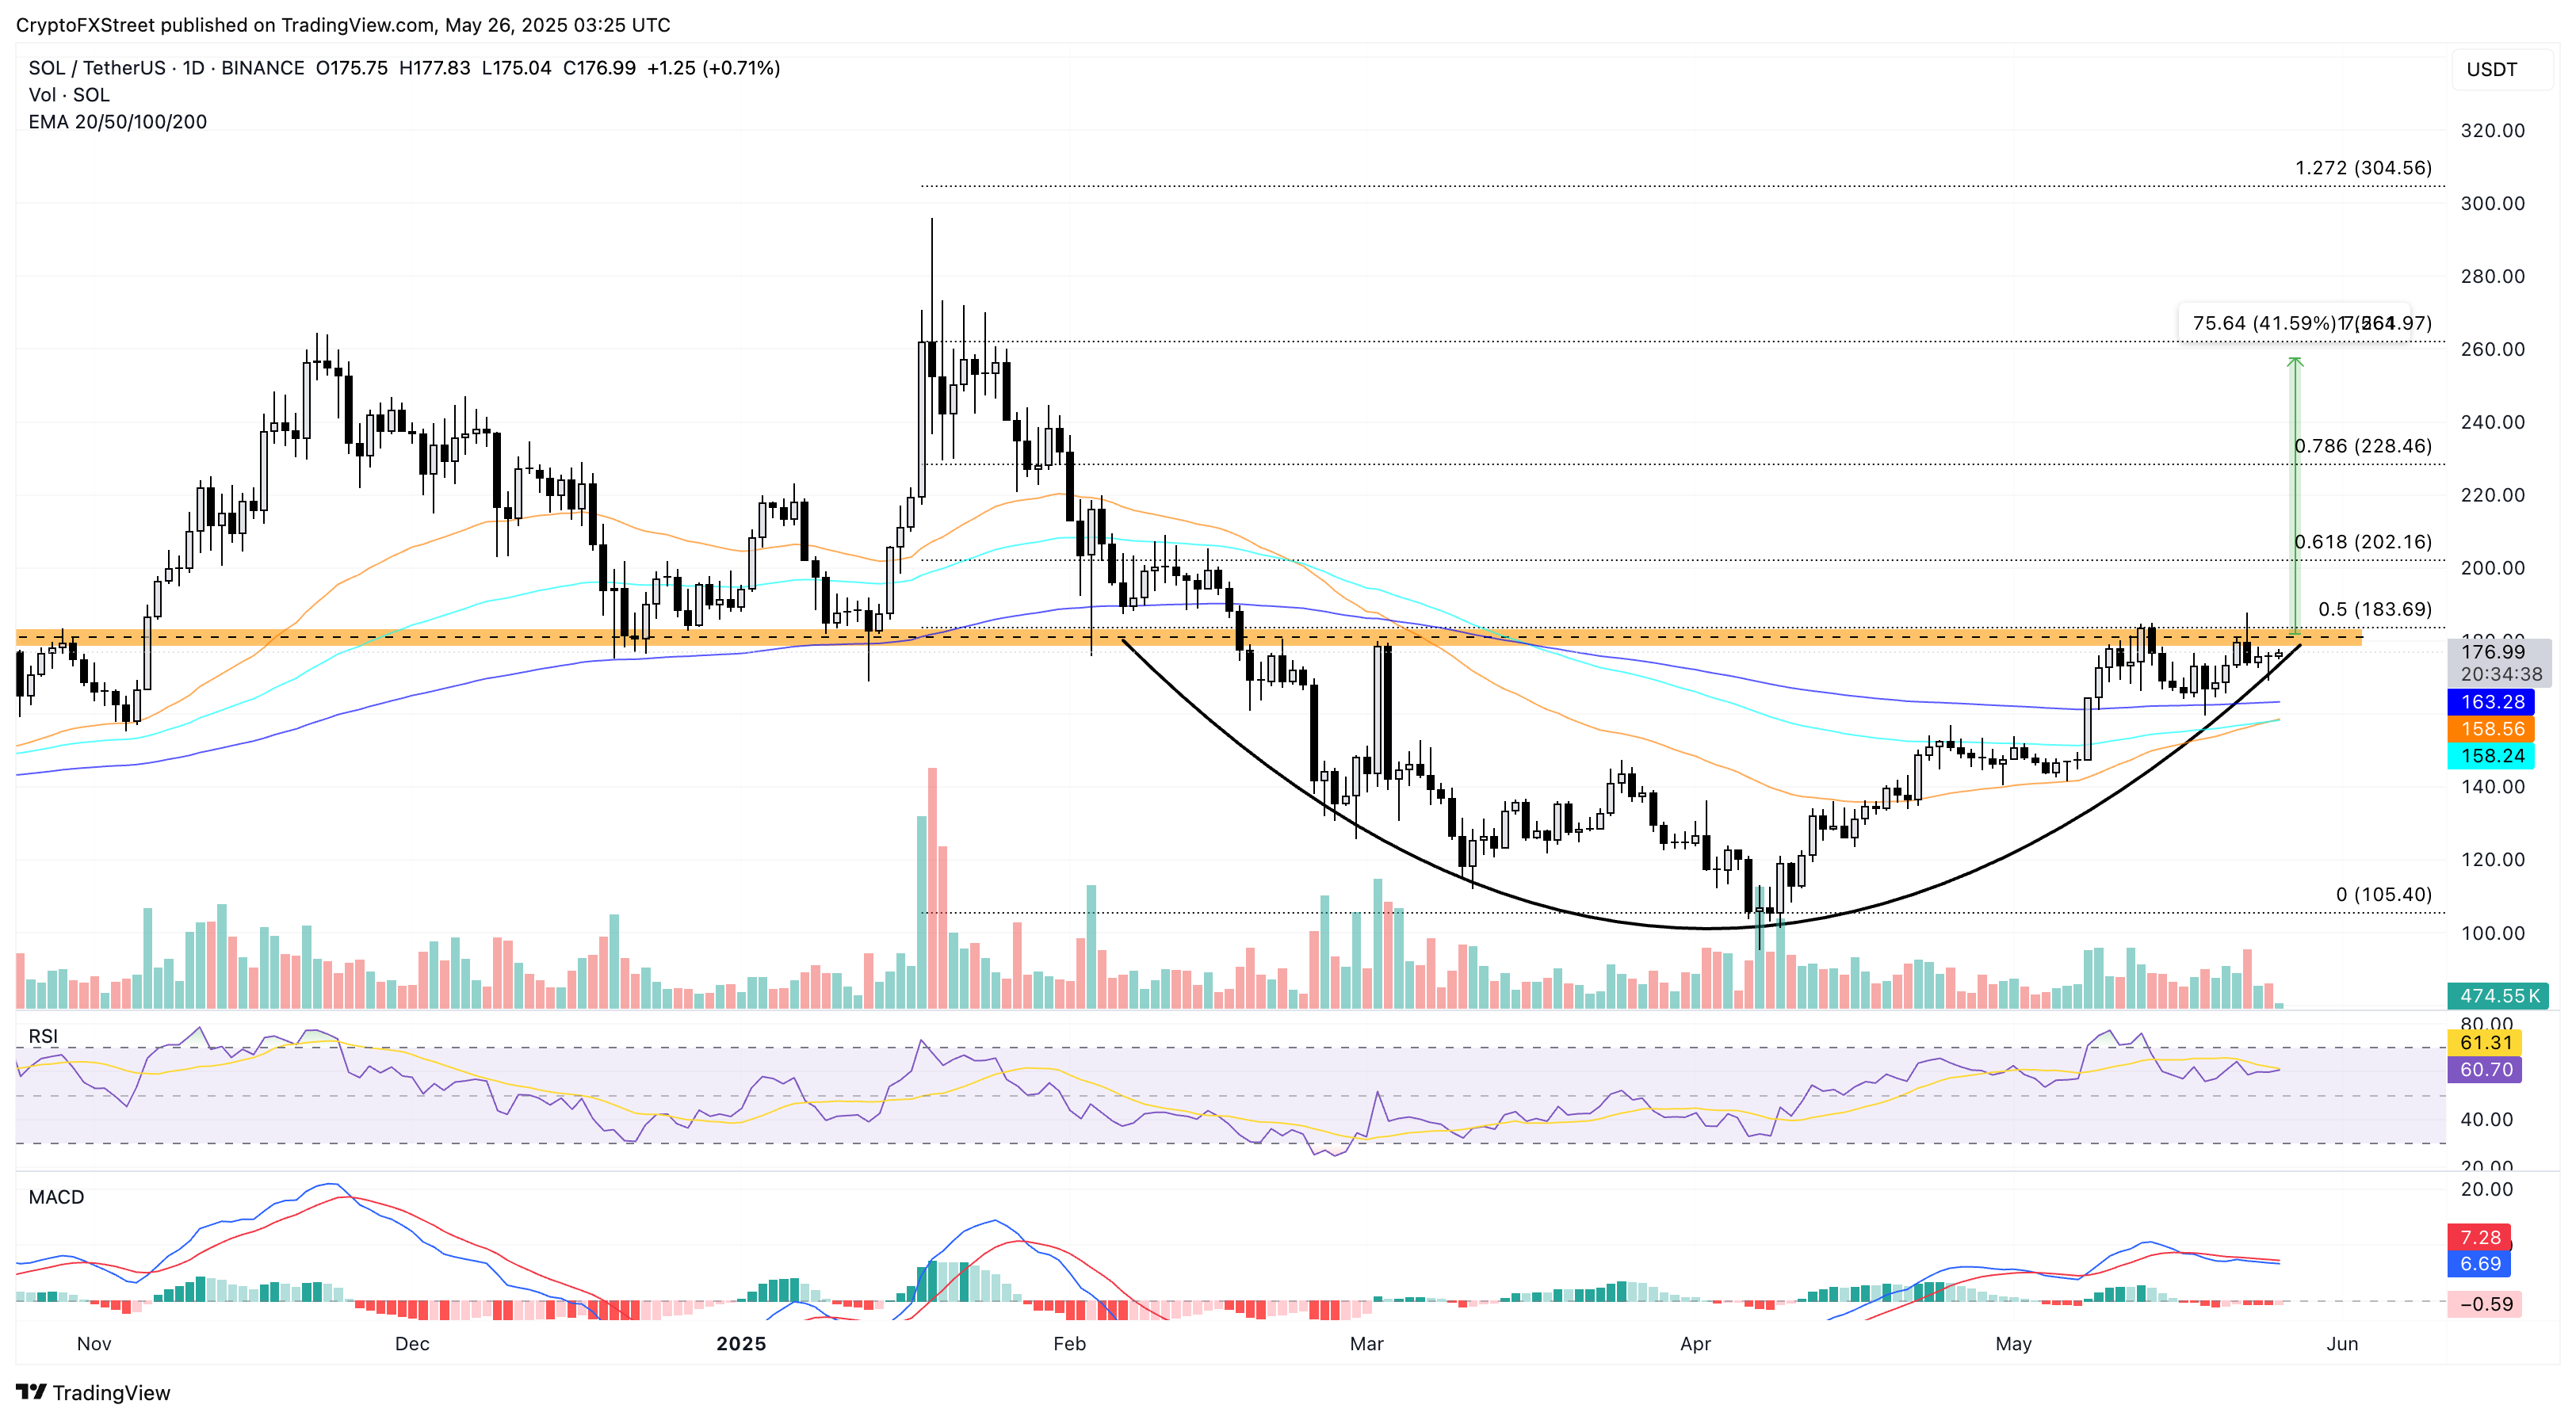
SOL/USDT daily price chart. Source: Tradingview
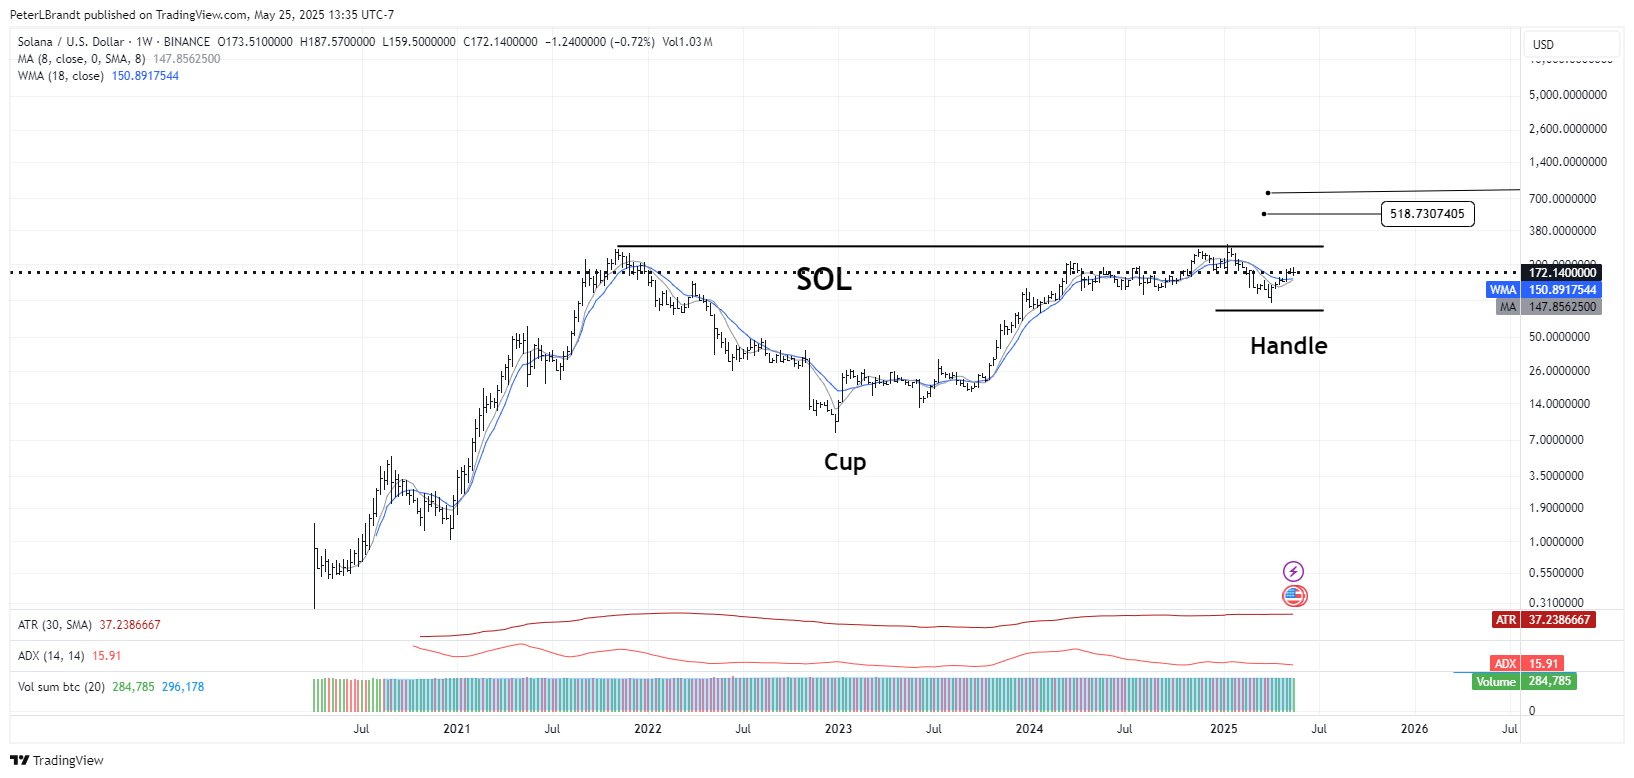
As Solana prepares for a bullish comeback, the analyst anticipates a cup-and-handle pattern breakout in the weekly timeframe. The pattern’s neckline coincides with the all-time high at $295, and the breakout target is estimated at $518.
On the flip side, a failure to give a bullish closing above the $183 neckline could result in a retest of the 200-day EMA at $163.
Analyst targets 90% upside in XRP to hit $4.43
XRP starts the week on a positive note, trading at $2.34 with a mild +0.17% move on Monday, at press time. On Sunday, the price action formed a long-tailed Doji candle, trading above the 50- and 100-day Exponential Moving Averages (EMAs).
As XRP takes off from the dynamic supports, a positive cycle is impending in a larger symmetrical triangle pattern, formed by three crests and two troughs since early 2025.
The Relative Strength Index (RSI) at 50 drops to midline from the overbought zone, reflecting a loss in momentum. Furthermore, the Moving Average Convergence/Divergence (MACD) and its signal line decline towards the centre line with a bearish crossover on May 19.
As XRP nears the triangle’s apex, a no-trading zone is established for price action traders until the price action gives a decisive close on either side. Based on the previous crests, a bullish conclusion with a closing above the upper trendline near $2.50 could face opposition near $2.58, $2.93, and $3.29.
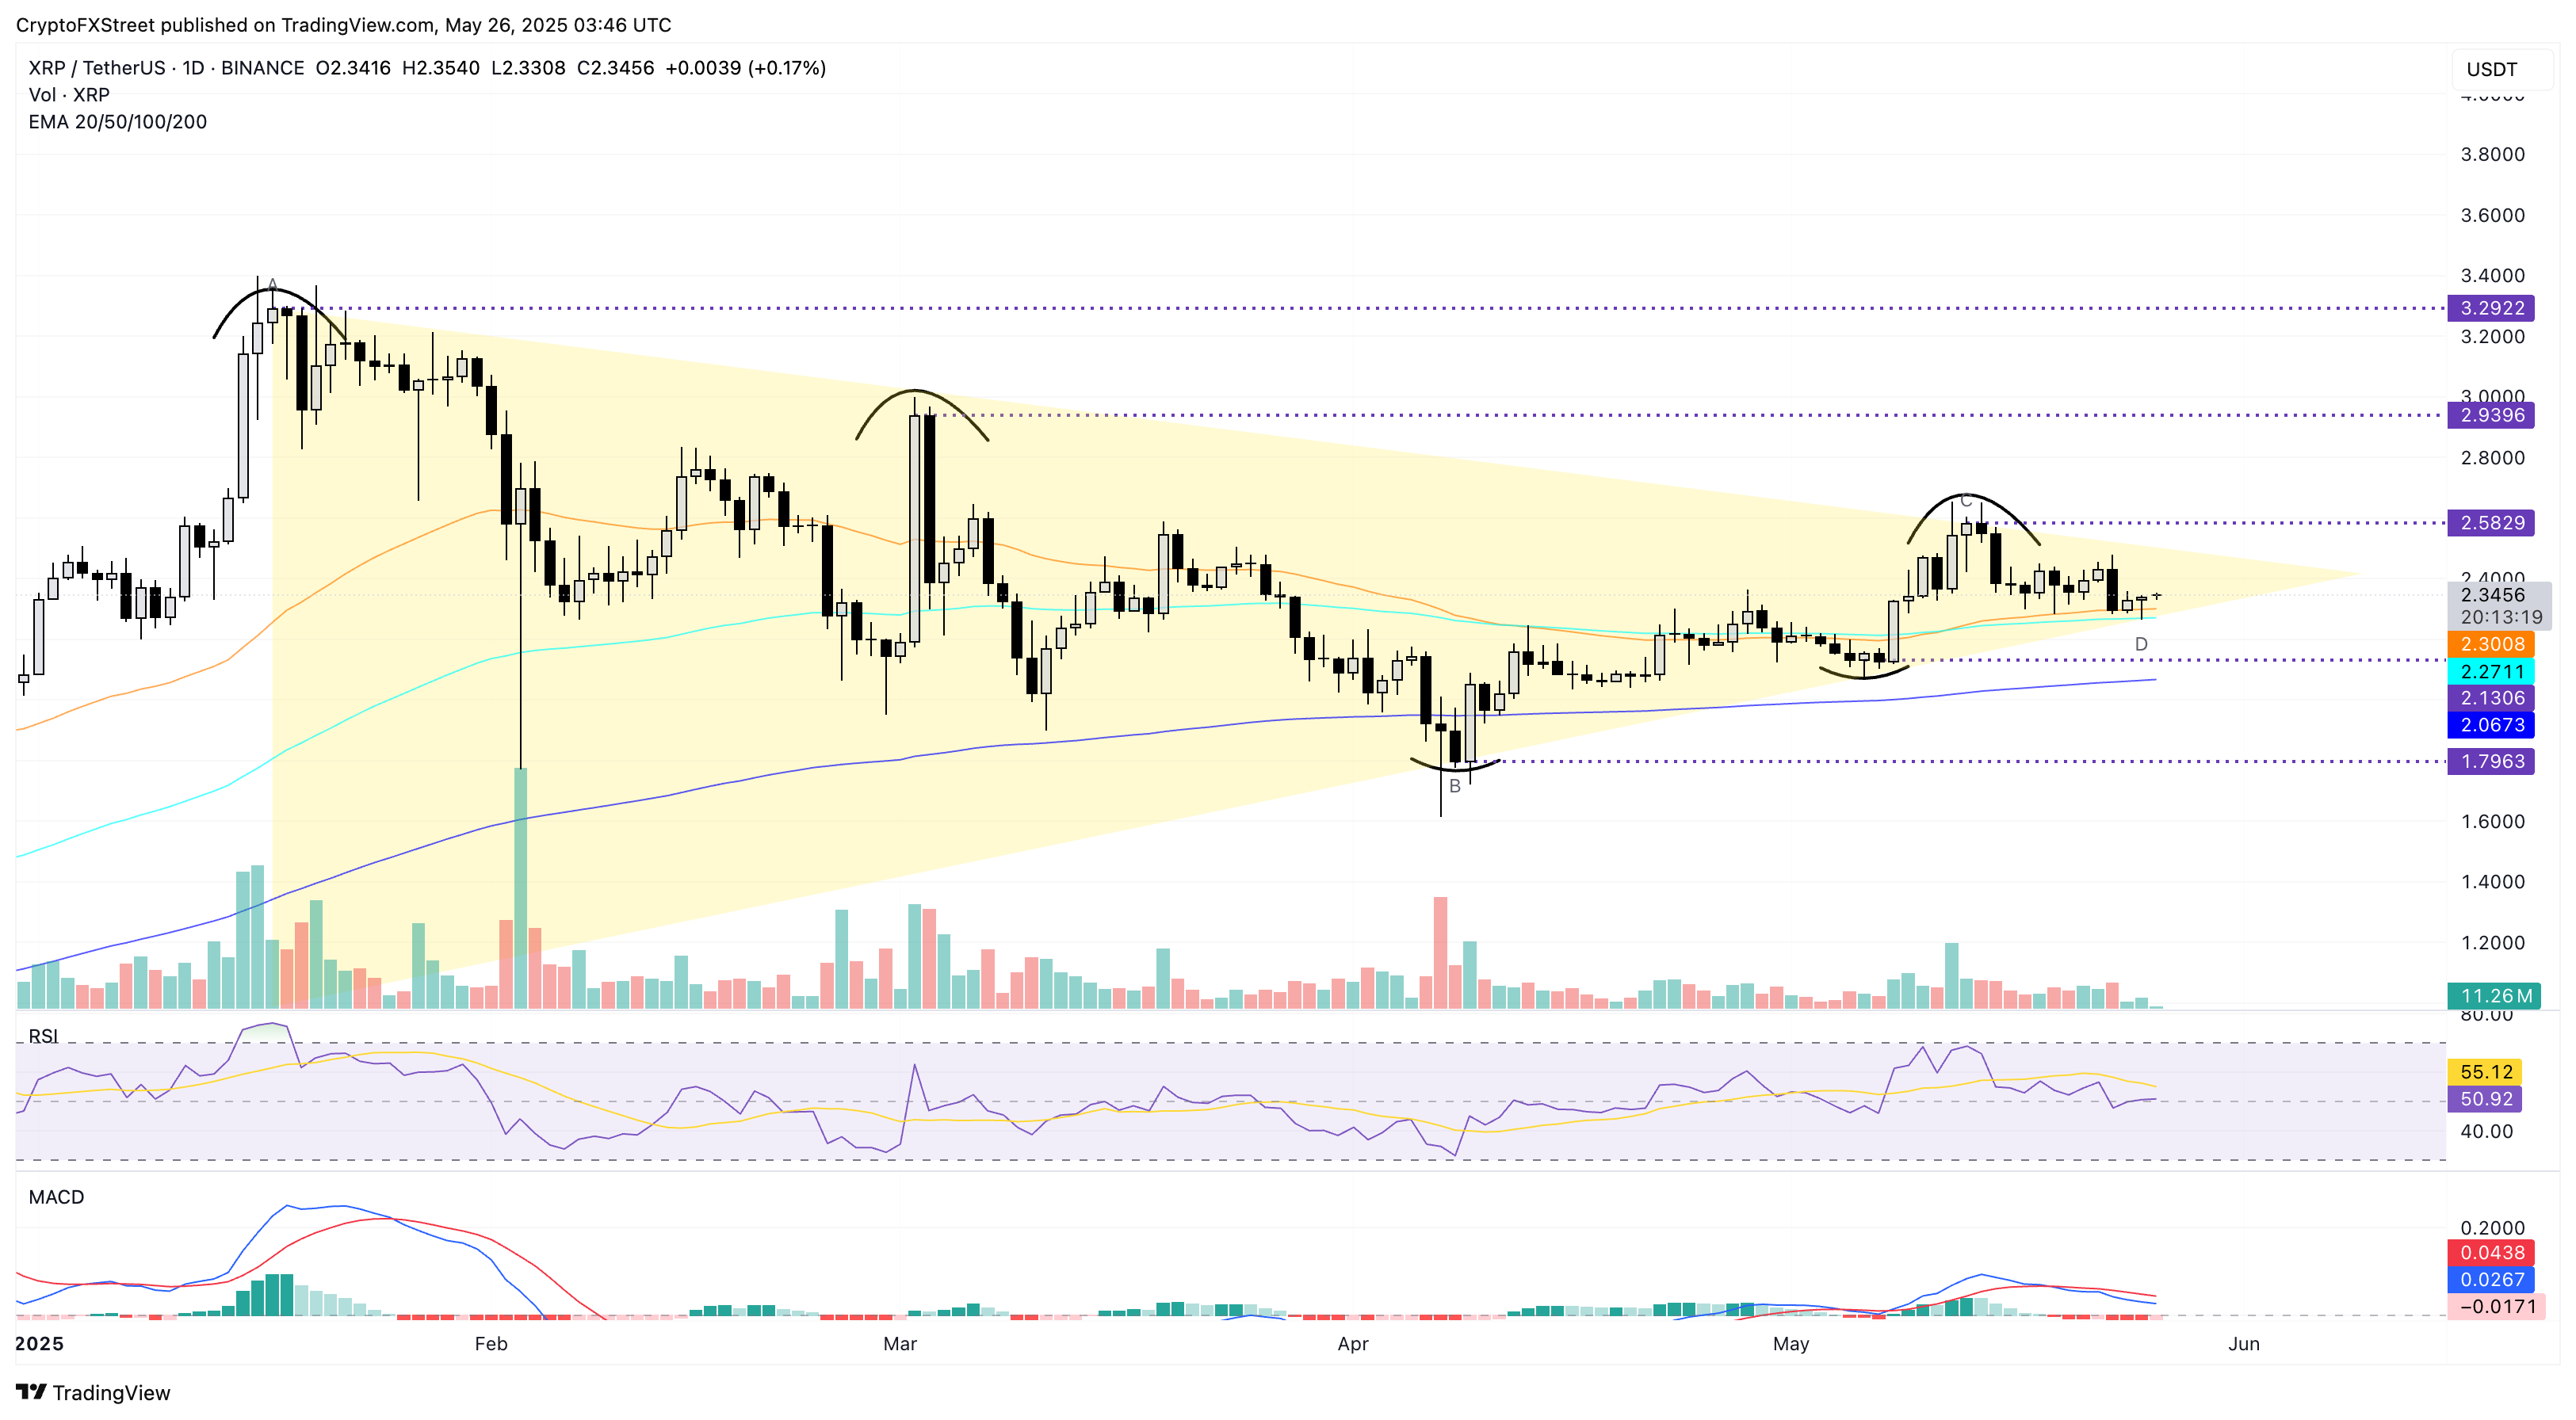
XRP/USDT daily price chart. Source: Tradingview
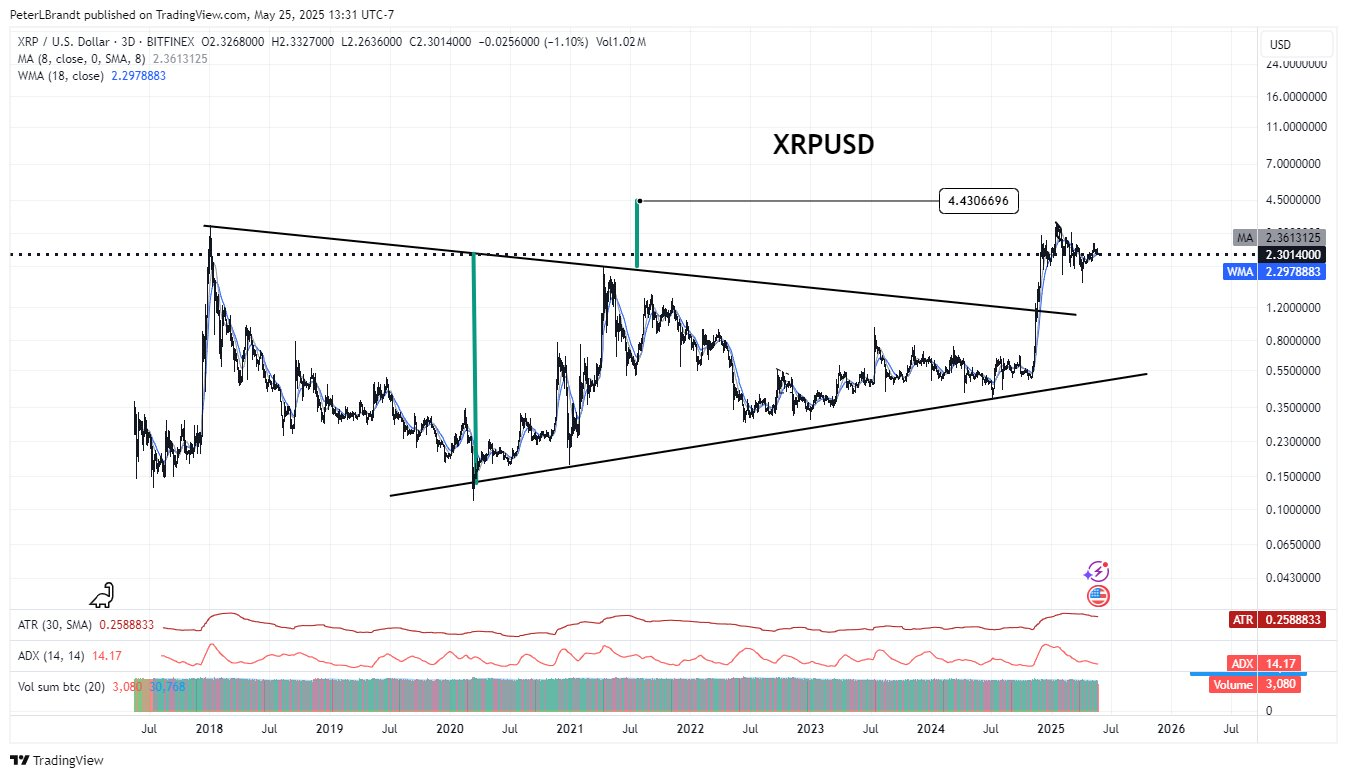
Based on a larger triangle breakout in the 3-day price chart, the analyst projects a strong upside move. With a short-term consolidation in the breakout rally, projected as a triangle pattern in the daily chart, the analyst targets $4.43.
However, a closing below the support trendline near the 100-day EMA at $2.27 could extend the downfall to $2.13 or $1.79.
Author

Vishal Dixit
FXStreet
Vishal Dixit holds a B.Sc. in Chemistry from Wilson College but found his true calling in the world of crypto.


