Verge Technical Analysis: XVG/USD is down 40% since its 2020 peak at $0.0098
- Verge price is currently at $0.0059 after a significant pullback.
- The daily chart is now in a downtrend and extremely weak.
Verge has finally succumbed to the selling pressure caused by the huge bull rally towards $0.01. Unfortunately, XVG lost the daily uptrend and has dropped below both daily EMAs which have crossed bearishly for the first time since February 2020.
XVG/USD daily chart
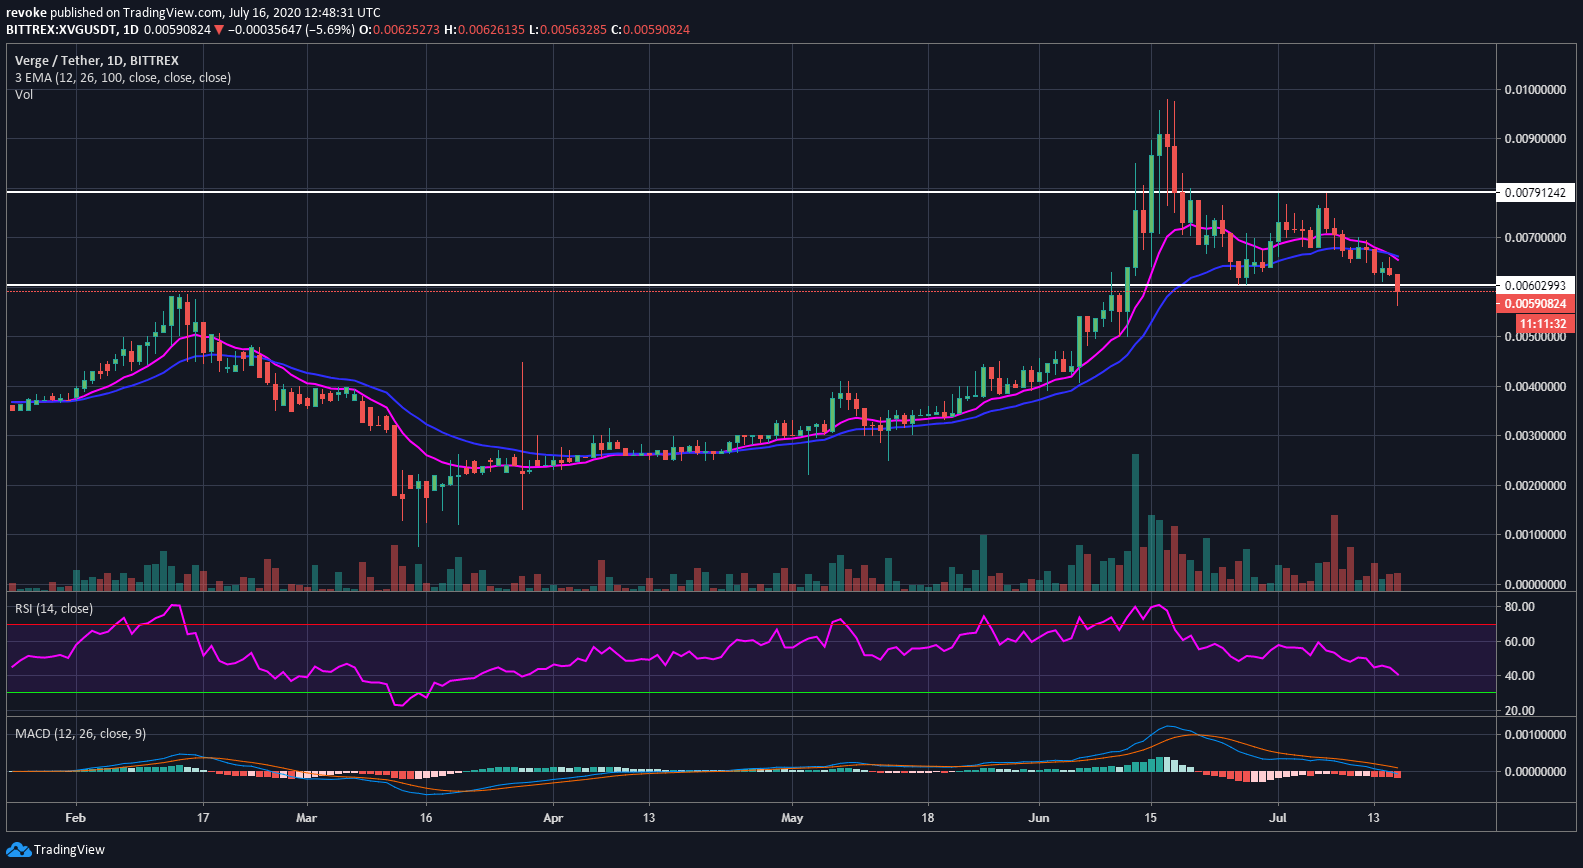
As mentioned above, the daily chart is in a downtrend and bulls don’t have many support levels nearby. The next support point is located at $0.005 but the daily RSI might reach oversold levels before that. The last time we saw the daily RSI being oversold was on March 13 when Verge price bounced significantly.
Author

Lorenzo Stroe
Independent Analyst
Lorenzo is an experienced Technical Analyst and Content Writer who has been working in the cryptocurrency industry since 2012. He also has a passion for trading.


