VeChain Price Prediction: VET rally might correct as multiple time frames flash ‘sell’
- VeChain price has surged nearly 85% in the last two weeks, setting a new all-time high at $0.160.
- The 1-day and the 4-hour time frame both hint at an overextended rally, suggesting a minor pullback
- Two demand zones ranging from $0.142 to $0.147 and $0.126 to $0.13 are areas of interest for this correction.

VeChain price has seen a tremendous increase over the last couple of months due to the parabolic rally. However, now VET bears could run amok as bulls take a breather.
VeChain price due for retracement
VeChain price has rallied more than 310% since March 2021. This bull run might face temporary exhaustion of buying pressure and result in a minor correction.
On the daily chart, the VET bulls have ignored the Momentum Reversal Indicator’s (MRI) reversal signal in the form of a red 'one' candlestick. If this momentum continues to persist, the VeChain price could tap the immediate breakout line at $0.17 after rising 7%.
Following this move, a retracement to the immediate support level at $0.147 seems likely. If the short-term bearish momentum overwhelms the buyers here, the pullback could extend toward the 78.6% Fibonacci retracement level at $0.128.
The bearish thesis becomes more evident on the 4-hour chart, where the VET price is already testing the MRI’s breakout line at $0.158. A failure to close above this will see VeChain drop to the immediate demand zone ranging from $0.142 to $0.147.
However, it is unlikely that this level will hold if the selling pressure increases. In such a case, a VeChain price might drop to the subsequent support zone that extends from $0.126 to $0.13. If the bulls decide to keep the parabolic rally alive, this area would be the best place to start.
Adding credence to the bearish outlook are the multiple A, B and C extensions, which suggest that VET’s upswing is overextended and needs to cool off before proceeding higher.
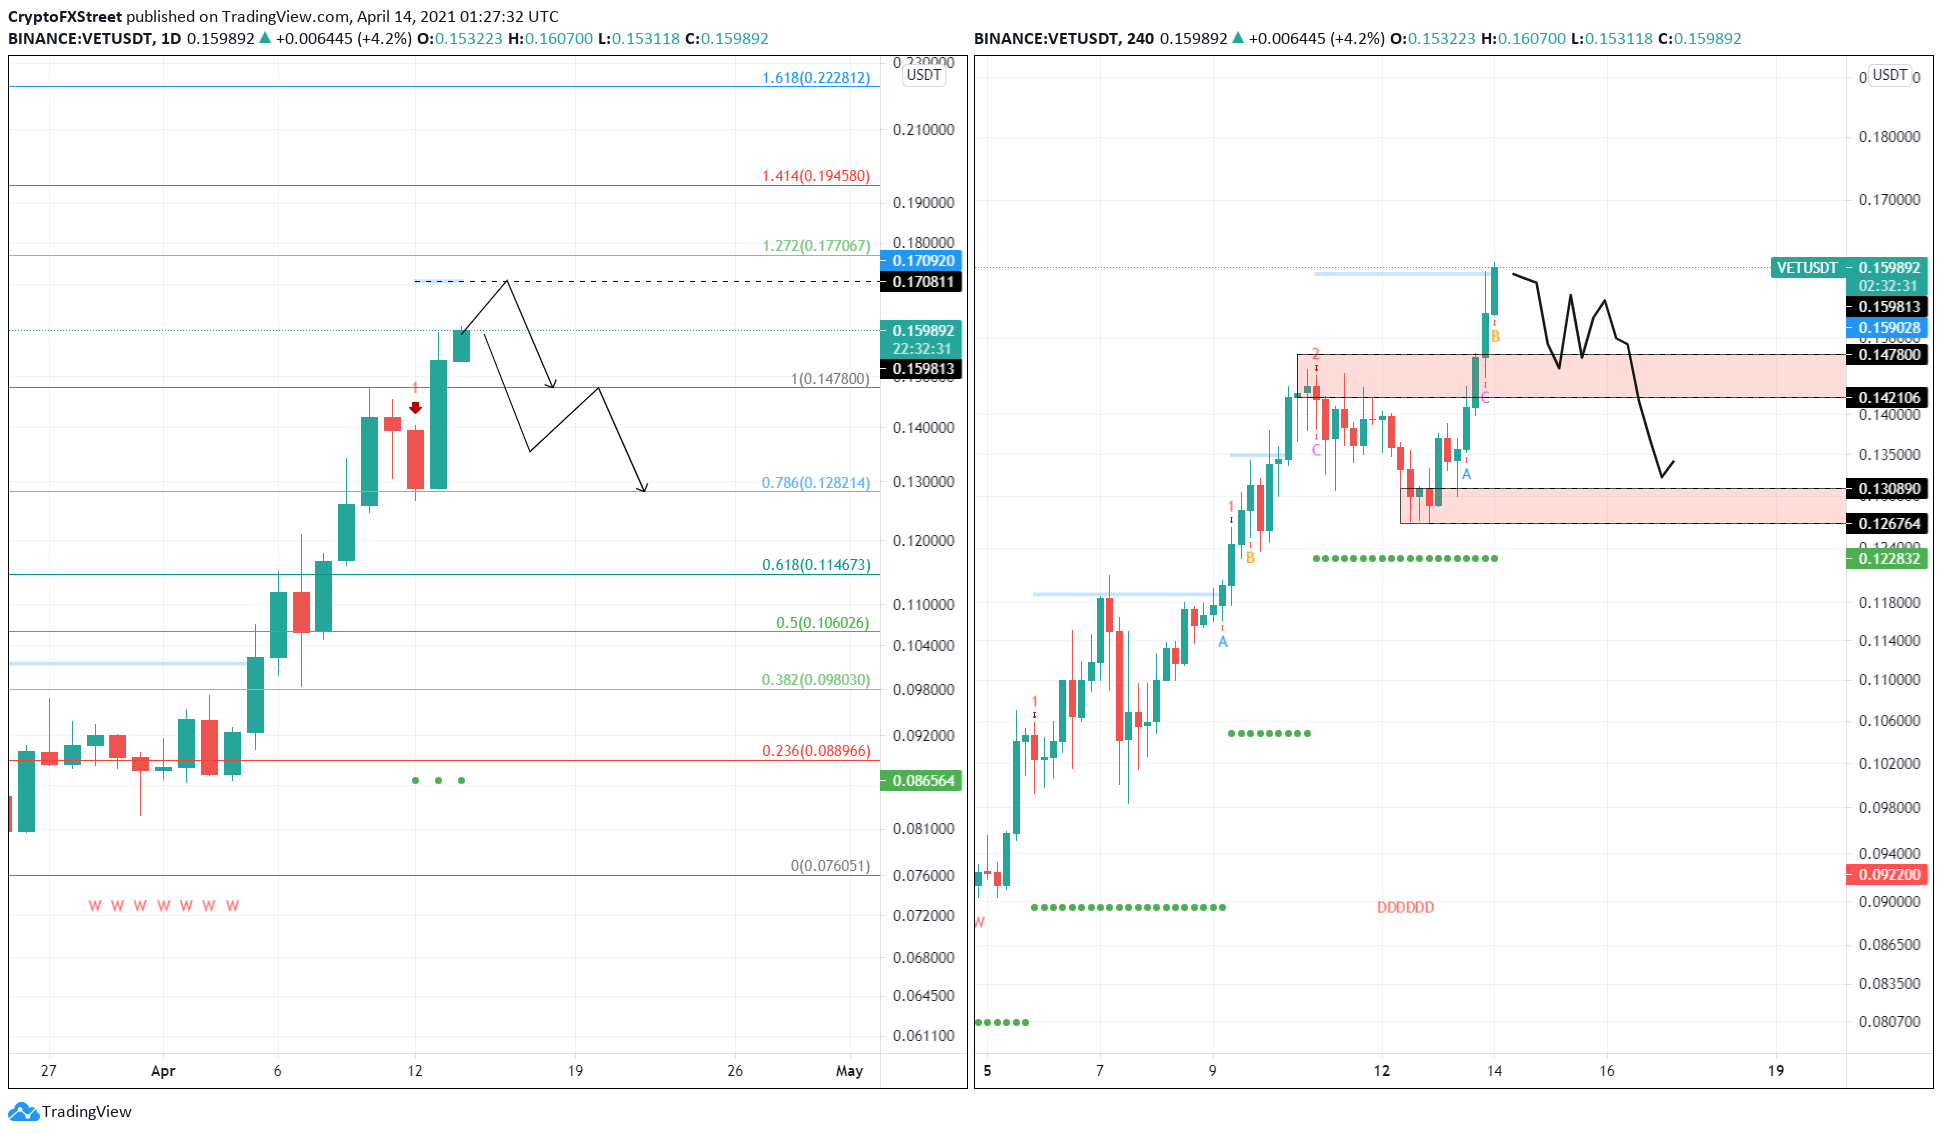
VET/USDT 1-day and 4-hour charts
The bearish thesis will face invalidation if the buyers slice through the breakout line at $0.17 on the daily chart.
In this scenario, the rally could extend to the 127.2% and the 141.4% Fibonacci extension levels at $0.177 and $0.194, respectively.
Author

Akash Girimath
FXStreet
Akash Girimath is a Mechanical Engineer interested in the chaos of the financial markets. Trying to make sense of this convoluted yet fascinating space, he switched his engineering job to become a crypto reporter and analyst.


