Share:
  • VeChain price action has formed a rising wedge on the daily timeframe.
  • However, VET could record a new all-time low unless bullish momentum abounds.
  • While this technical formation indicates bearishness due to weakening buyer momentum, conservative investors can wait for a secondary wave.
  • A decisive daily candlestick close above $0.032 could invalidate the bearish thesis.

VeChain (VET) price action since August shows growing volatility as VET consolidates within a broader fixed market range. The price action is characterized by explosive moves south countered by less aggressive moves north, suggesting a readiness among investors to short the market once it tests the upper boundary. Possible reasons below.

Also Read: Weekly recap: TRON expands to Ethereum, XRP social volume spikes, Credit Suisse-backed firm integrates Polygon

VeChain price coils up for a breakdown

VeChain (VET) price action has formed a rising ‘ascending’ wedge pattern. This technical formation forecasts a bearish chart pattern, signaling an imminent breakout to the downside. The pattern is formed by connecting a series of lower highs to form the upper boundary and a series of higher lows to form the lower boundary. Notably, the upper boundary is often less steep than the lower boundary, suggesting less aggression coming from the bulls than bears. As VeChain price cruises through the prior highs, it is not getting enough momentum to make higher highs.

VeChain price could break below the lower boundary of the pattern at around $0.018 as overhead pressure from the 50-, 100-, and 200-day Exponential Moving Averages (EMA) abound at $0.020, $0.021, and $0.023 respectively. The Relative Strength Index (RSI) adds credence to this thesis because its downward direction indicates weakening momentum.

Given that the price has only tested the upper boundary a few times, there is less liquidity accumulation around that level, giving VeChain price less incentive to break above. The impulsive moves south after every retest of the upper boundary demonstrate a unique keenness to short the market by triggering stop losses.

To support the bearish case, whenever VeChain price hits the support offered by the lower boundary, there are traders looking to buy VET. This is indicated by the ensuing successive green bars. Accordingly, a cluster of stop losses accumulates just below this support. This incentivizes the altcoin to break below this lower boundary, triggering those stop losses to consume liquidity.

In addition, VeChain price making lower highs coming into the support shows that bears are in control, a sign of strength that could favor the downside. If this thesis pans out, VET could break below the lower boundary to tag the $0.017 support level.

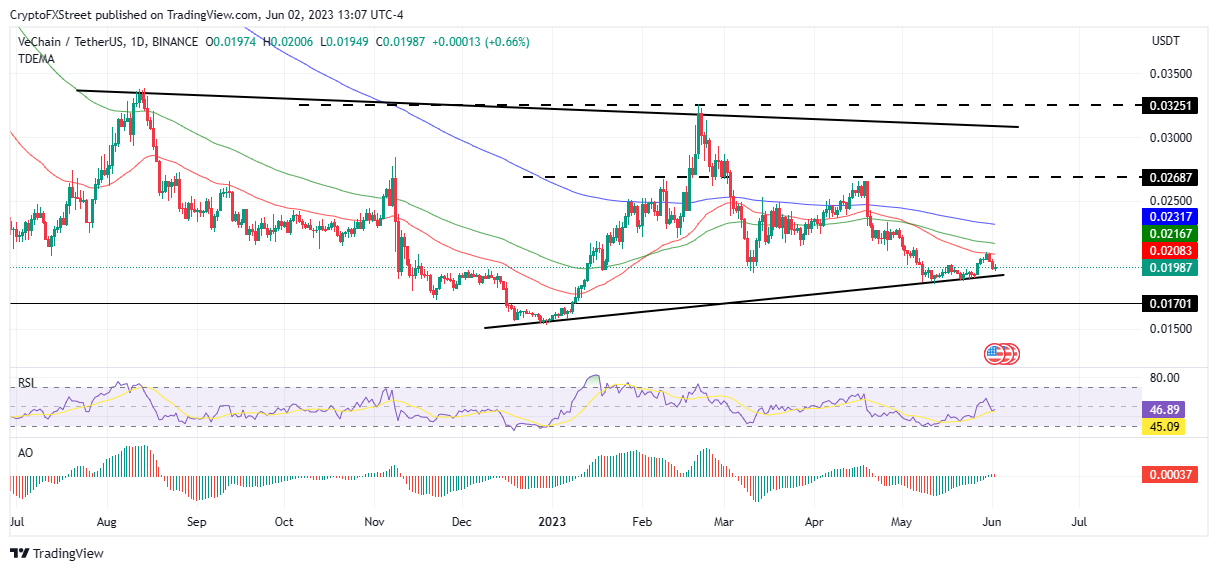
VET/USDT 1-Day Chart

On the other hand, conservative investors can wait for a secondary wave below the support provided by the lower boundary of the ascending wedge. The liquidity collected underneath could fuel a strong move upward.

If sustained and VET manages to flip the EMA resistances into support, VeChain price could break above the $0.026 resistance and escape the upper boundary of the governing chart pattern. A daily candlestick close above the $0.032 would invalidate the bearish thesis.


Information on these pages contains forward-looking statements that involve risks and uncertainties. Markets and instruments profiled on this page are for informational purposes only and should not in any way come across as a recommendation to buy or sell in these assets. You should do your own thorough research before making any investment decisions. FXStreet does not in any way guarantee that this information is free from mistakes, errors, or material misstatements. It also does not guarantee that this information is of a timely nature. Investing in Open Markets involves a great deal of risk, including the loss of all or a portion of your investment, as well as emotional distress. All risks, losses and costs associated with investing, including total loss of principal, are your responsibility. The views and opinions expressed in this article are those of the authors and do not necessarily reflect the official policy or position of FXStreet nor its advertisers. The author will not be held responsible for information that is found at the end of links posted on this page.

If not otherwise explicitly mentioned in the body of the article, at the time of writing, the author has no position in any stock mentioned in this article and no business relationship with any company mentioned. The author has not received compensation for writing this article, other than from FXStreet.

FXStreet and the author do not provide personalized recommendations. The author makes no representations as to the accuracy, completeness, or suitability of this information. FXStreet and the author will not be liable for any errors, omissions or any losses, injuries or damages arising from this information and its display or use. Errors and omissions excepted.

The author and FXStreet are not registered investment advisors and nothing in this article is intended to be investment advice.

Join Telegram

Follow us on Telegram

Stay updated of all the news

Join Telegram

Recommended content


Follow us on Telegram

Stay updated of all the news

Join Telegram

Recommended Content

Editors’ Picks

Dogecoin price bullish outlook intensifies as DOGE turns 10

Dogecoin price bullish outlook intensifies as DOGE turns 10

Dogecoin price has sustained the bullish outlook since October 18, when the broader market turned green, leading meme coins in an uptrend, which is no mean feat. The 65% climb has ushered the dog-themed cryptocurrency to its tenth birthday since its official launch on December 6, 2013.

More Dogecoin News

Bitcoin-based meme coin ORDI price action wobbles after 1,100% rally

Bitcoin-based meme coin ORDI price action wobbles after 1,100% rally

The Bitcoin-based BRC-20 meme coin, which had people confused as being an actual valuable token, is now slowly creeping up to that status. ORDI price rise over the past couple of days has been astonishing, and with BTC driving the price and crossing $44,000, ORDI is also gaining rapidly. But not for long.

More Ordi News

Arbitrum price veers as hard fork proposal receives 99.84% votes in favor

Arbitrum price veers as hard fork proposal receives 99.84% votes in favor

Arbitrum's price surpassed expectations as the altcoin managed to restrict the fluctuation over the past 24 hours. This is because ARB was forecasted to rally following the result of the proposal to essentially hard-fork the chain.

More Arbitrum News

Bitcoin price hits $44,000 as Coinbase CEO speculates BTC could be key to extending Western civilization

Bitcoin price hits $44,000 as Coinbase CEO speculates BTC could be key to extending Western civilization

Bitcoin (BTC) price has revisited levels last seen in April 2022, prior to the collapse of the Terra UST ecosystem. Its foray above the $42,000 psychological level has market watchers enthused.

More Bitcoin News

Analyzing potential $30k corrections ahead of BTC ETF approval

Analyzing potential $30k corrections ahead of BTC ETF approval

Bitcoin has slowed down its 2023 bull rally as it approaches the $37,000 level. After three weeks of consolidating around this level, BTC shows no directional bias whatsoever. Some investors speculate this could be an upward-sloping accumulation that leads to a $40,000 rally.

Read full analysis

BTC

ETH

XRP