VeChain price consolidates in a tight zone, but VET relative strength tumbles
- VeChain price meeting resistance at the 61.8% Fibonacci retracement level.
- Yesterday’s advance was bullish, albeit an incremental step towards claiming new highs.
- Social media volume responding to the rebound from the April 23 low.

VeChain price triggered the April 23 hammer candlestick pattern yesterday by rising above the hammer high. As long as VET limits pullbacks to the region of the ascending channel’s upper trend line, it should be poised to build on the rebound.
VeChain price generating more social media buzz
The price rebound has been matched by an uptick in social media volume, pointing to renewed interest among the ranks of retail investors. The social volume is the number of VET mentions on 1000+ crypto social media channels, including Telegram groups, Twitter, crypto subreddits, discord groups, private trader chats, and more.
To reclaim the all-time high, VET will need the participation of retail traders and investors, placing social volume metrics in a supporting role for confirmation and timing.
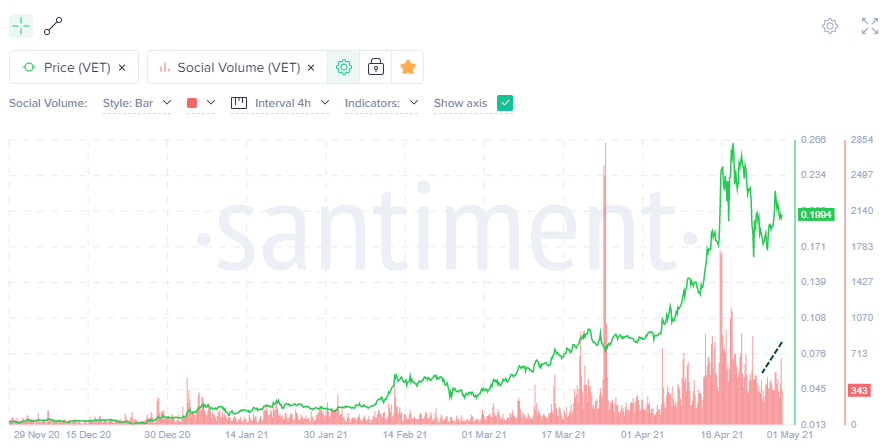
VET social volume data
VET/BTC reaches extreme overbought reading
VeChain exploded higher in 2021, taking the VET/BTC price above 2018 high and to the 138.2% Fibonacci extension of the 2018-2019 bear market, while also recording the highest weekly Relative Strength Index (RSI) level since the cryptocurrency pair’s high in July 2020. The pair has since fallen to the 23.6% retracement level of the advance from the 2019 low.
Moving forward, VET/BTC could continue the correction to release the heightened price compression from the sharp rally, which foretells declining relative strength for VET against the broader cryptocurrency market.

VET/BTC weekly chart
VeChain price needs new money to look for higher levels
VET advanced in an ascending channel from late November 2020 until this month, when it went parabolic before succumbing to the collective sell-off in cryptocurrencies.
The decline culminated in a massive hammer candlestick pattern on April 23. The low of the hammer nearly touched the 61.8% Fibonacci retracement of the cup-with-handle pattern breakout on January 3 and was built on the fourth largest daily volume in 2021, raising the odds it was the end of the implosion.
VeChain price has since oscillated between the 61.8% retracement of the April decline and the channel’s upper trend line as VET absorbs residual selling following the bounce. With yesterday’s trigger of the hammer candlestick pattern, the digital token should dismantle the magnet effect associated with the 61.8% retracement at $0.209 and charge through the minor declining trend line at $0.240.
The ultimate objective is printing a new high and testing the 361.8% extension of the August-November correction in 2020 at $0.309.
Due to the overbought readings versus the USD and BTC, speculators should anticipate a more tempered rally.
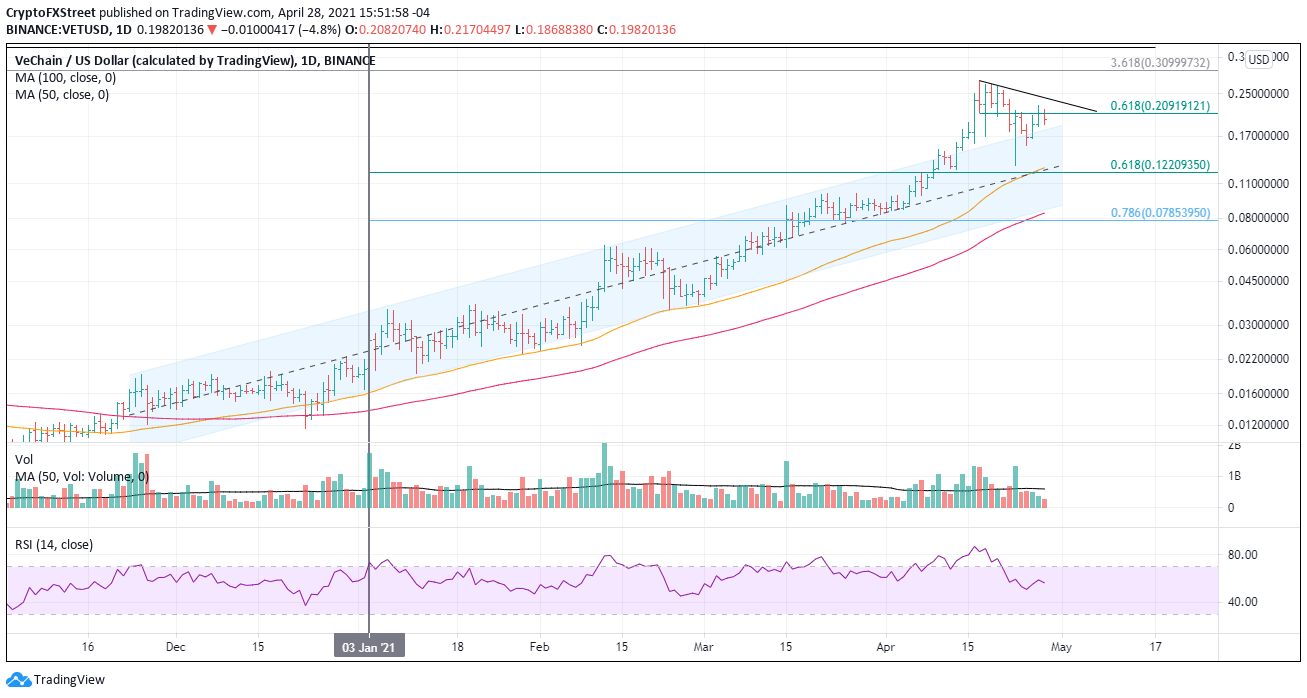
VET/USD daily chart
For the bullish outlook to be invalidated, VET would have to undercut the April 23 low of $0.128, which at this point appears unlikely.
Author

Sheldon McIntyre, CMT
Independent Analyst
Sheldon has 24 years of investment experience holding various positions in companies based in the United States and Chile. His core competencies include BRIC and G-10 equity markets, swing and position trading and technical analysis.




