Stacks Price Prediction: Key resistance in focus as Bitcoin layer-2 demand and TVL climb
- Stacks struggles to surpass a key resistance trendline near $0.3500 despite a 17% rise on Sunday.
- DeFi data shows a steady increase in Stacks TVL amid rising Bitcoin prices and US-Venezuelan tensions.
- Derivatives data suggest an increase in STX futures Open Interest, indicating renewed risk-on sentiment.
Stacks (STX) is down 2% at press time on Monday, struggling to surpass a resistance trendline near $0.3500. DeFi data shows an increase in the Total Value Locked (TVL) on Stacks, a layer-2 protocol built on Bitcoin, suggesting increased on-chain demand. Additionally, a spike in STX futures Open Interest indicates a rise in retail demand.
Stacks regain on-chain and retail demand
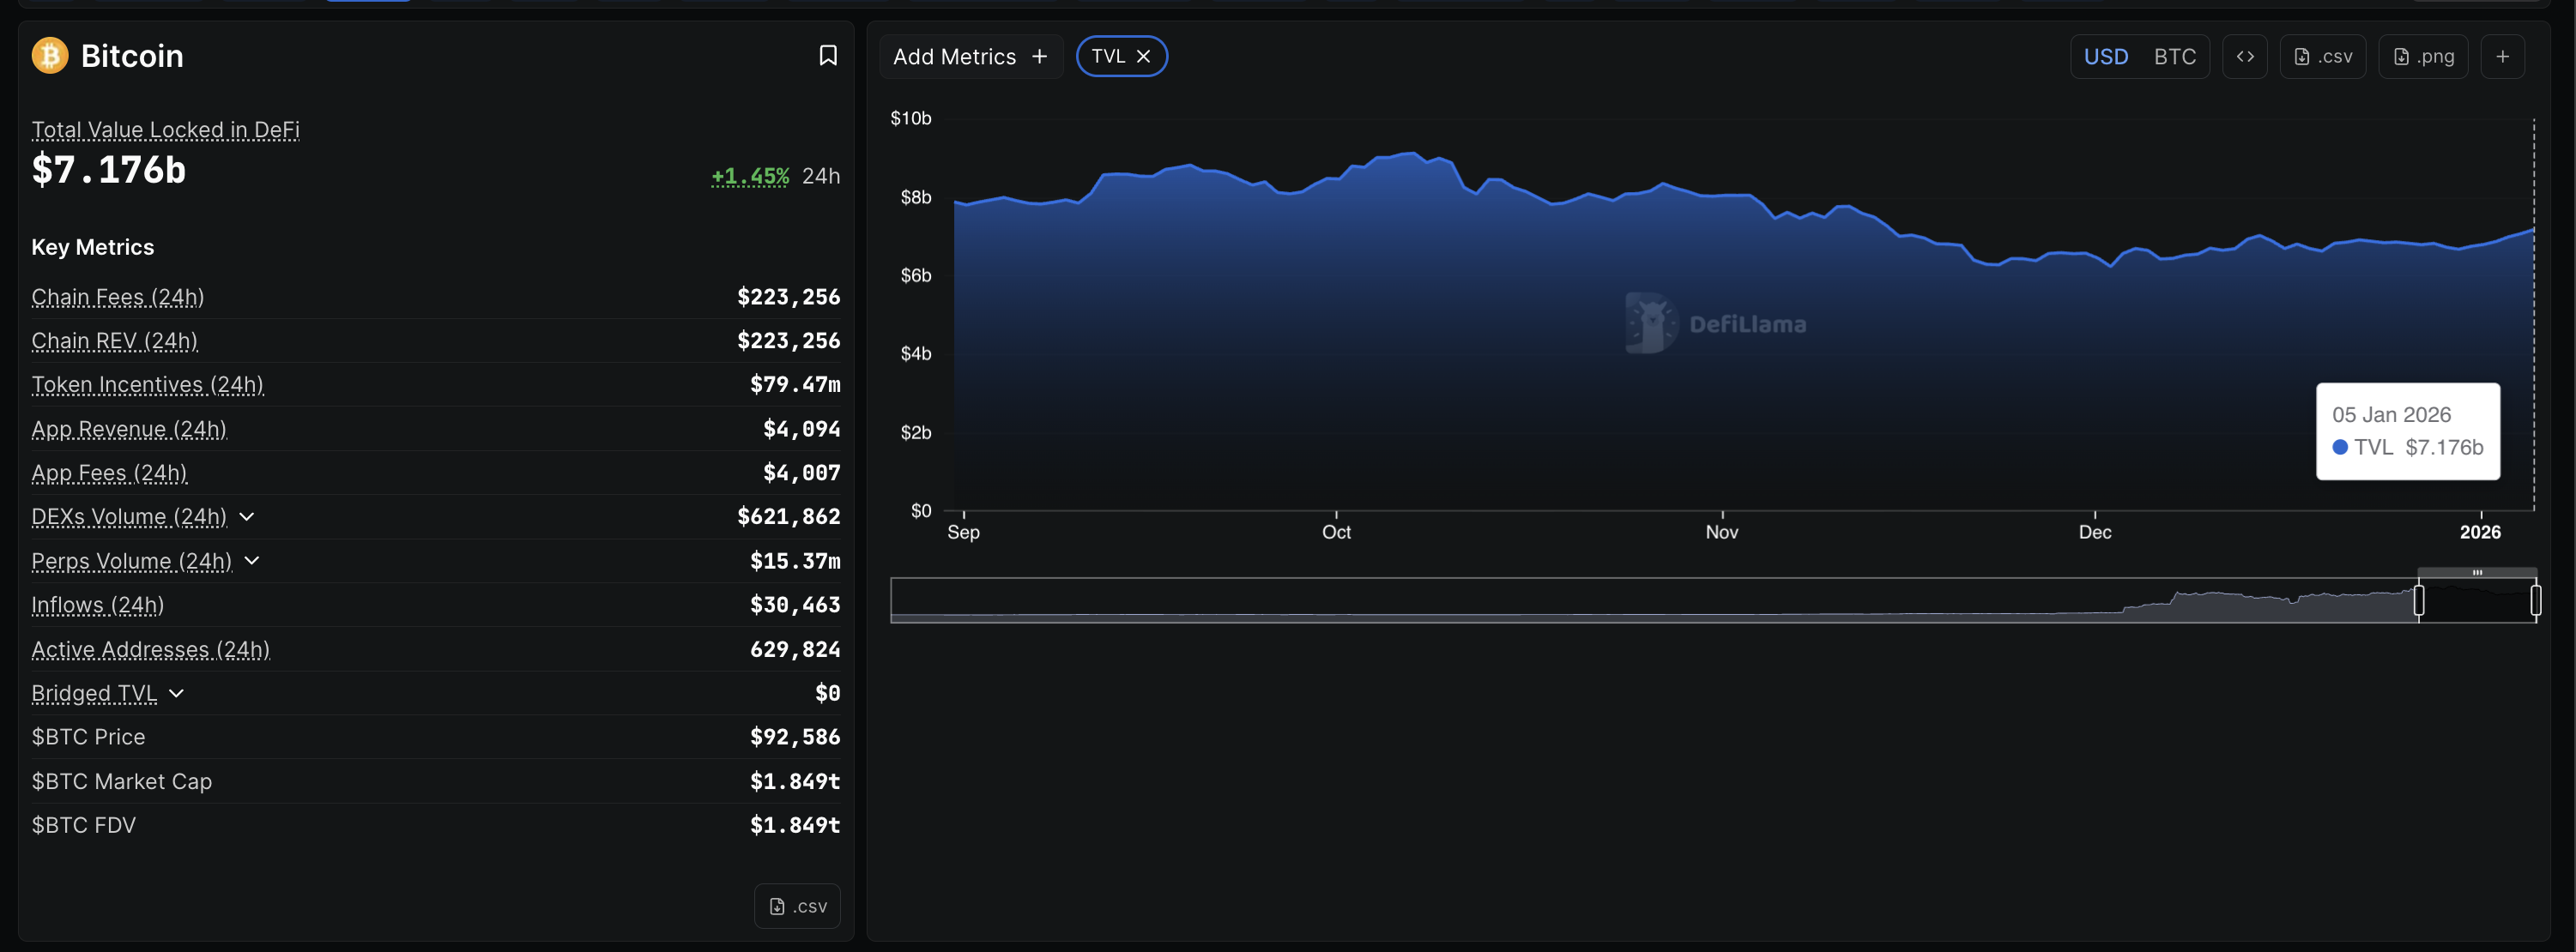
Stacks, a Bitcoin layer-2 protocol offering BTC staking, is gaining traction amid the New Year rebound. DeFiLlama data shows that Bitcoin’s TVL is at $7.176 billion, up from $6.728 billion last week. The renewed interest in Bitcoin’s DeFi utility aligns with the ongoing US-Venezuelan crisis, which could shrink BTC's supply.
Additionally, the announcement of Circle’s USDCx, a US Dollar stablecoin on Bitcoin, opens the door to US Dollar settlement and improves interoperability via xReserve, which connects Circle’s multichain rolls with Stacks.
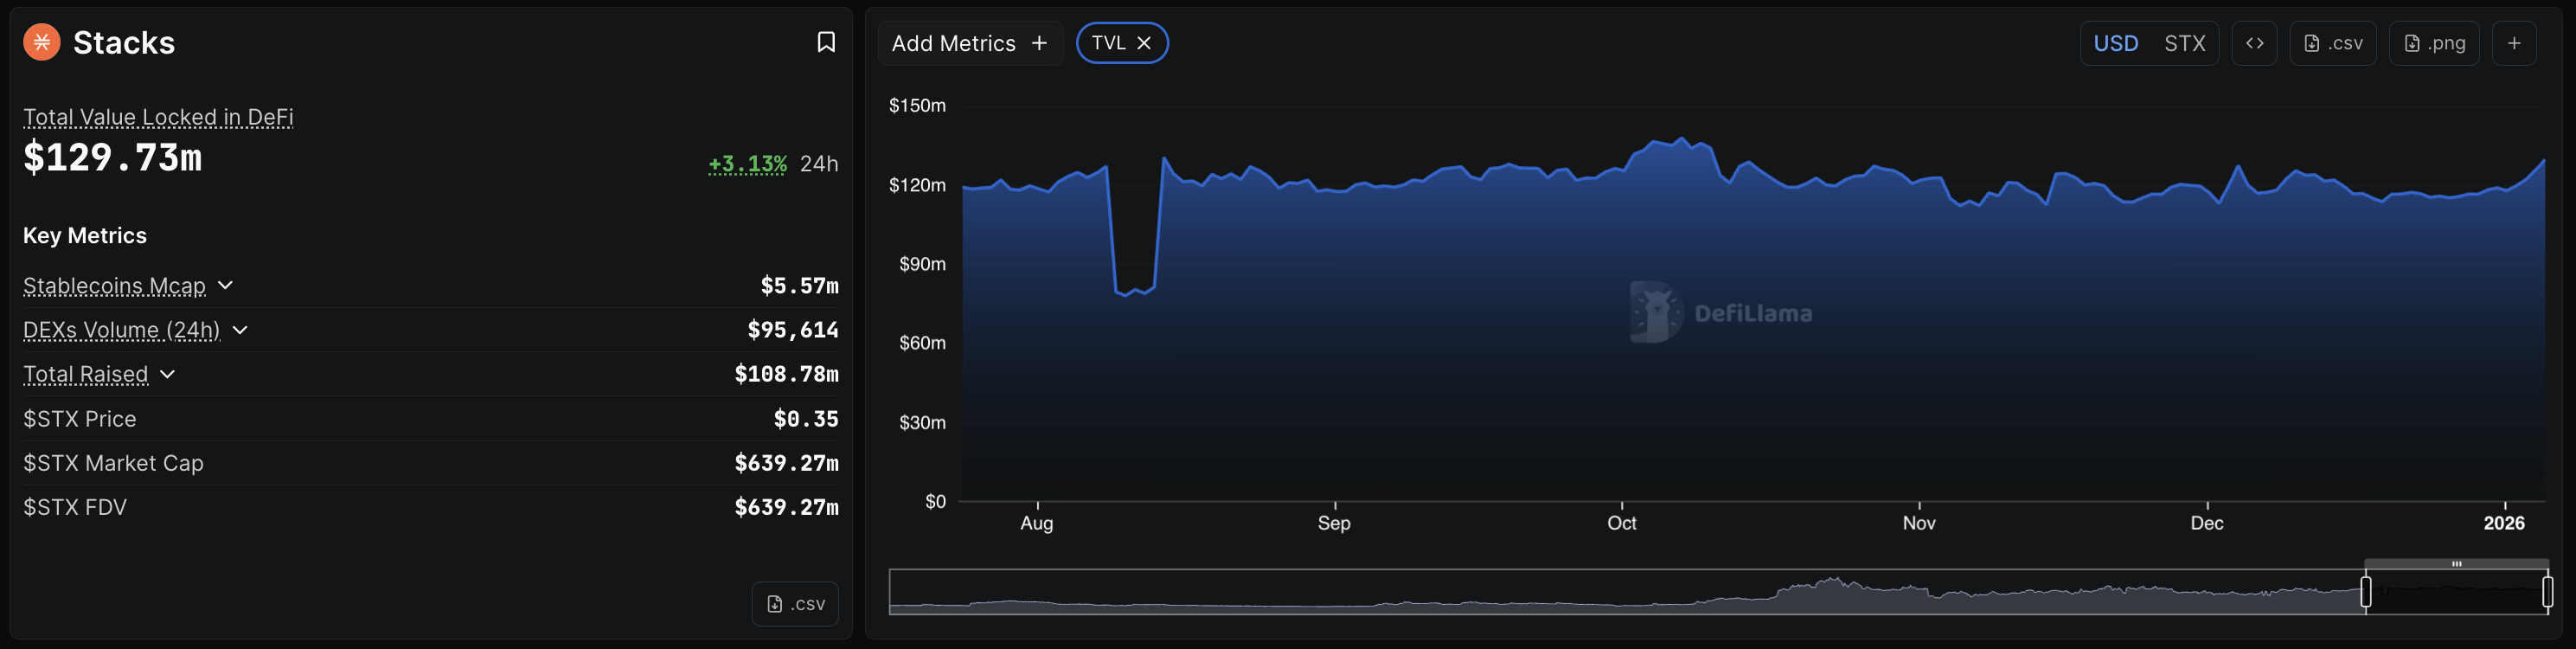
Despite the USDCx launch on December 18, layer-2 activity is waking in the New Year. DeFiLlama data shows that Stacks TVL is at $129.73 million, up from $116.62 million last week, corroborating the increase in DeFi activity on Bitcoin.
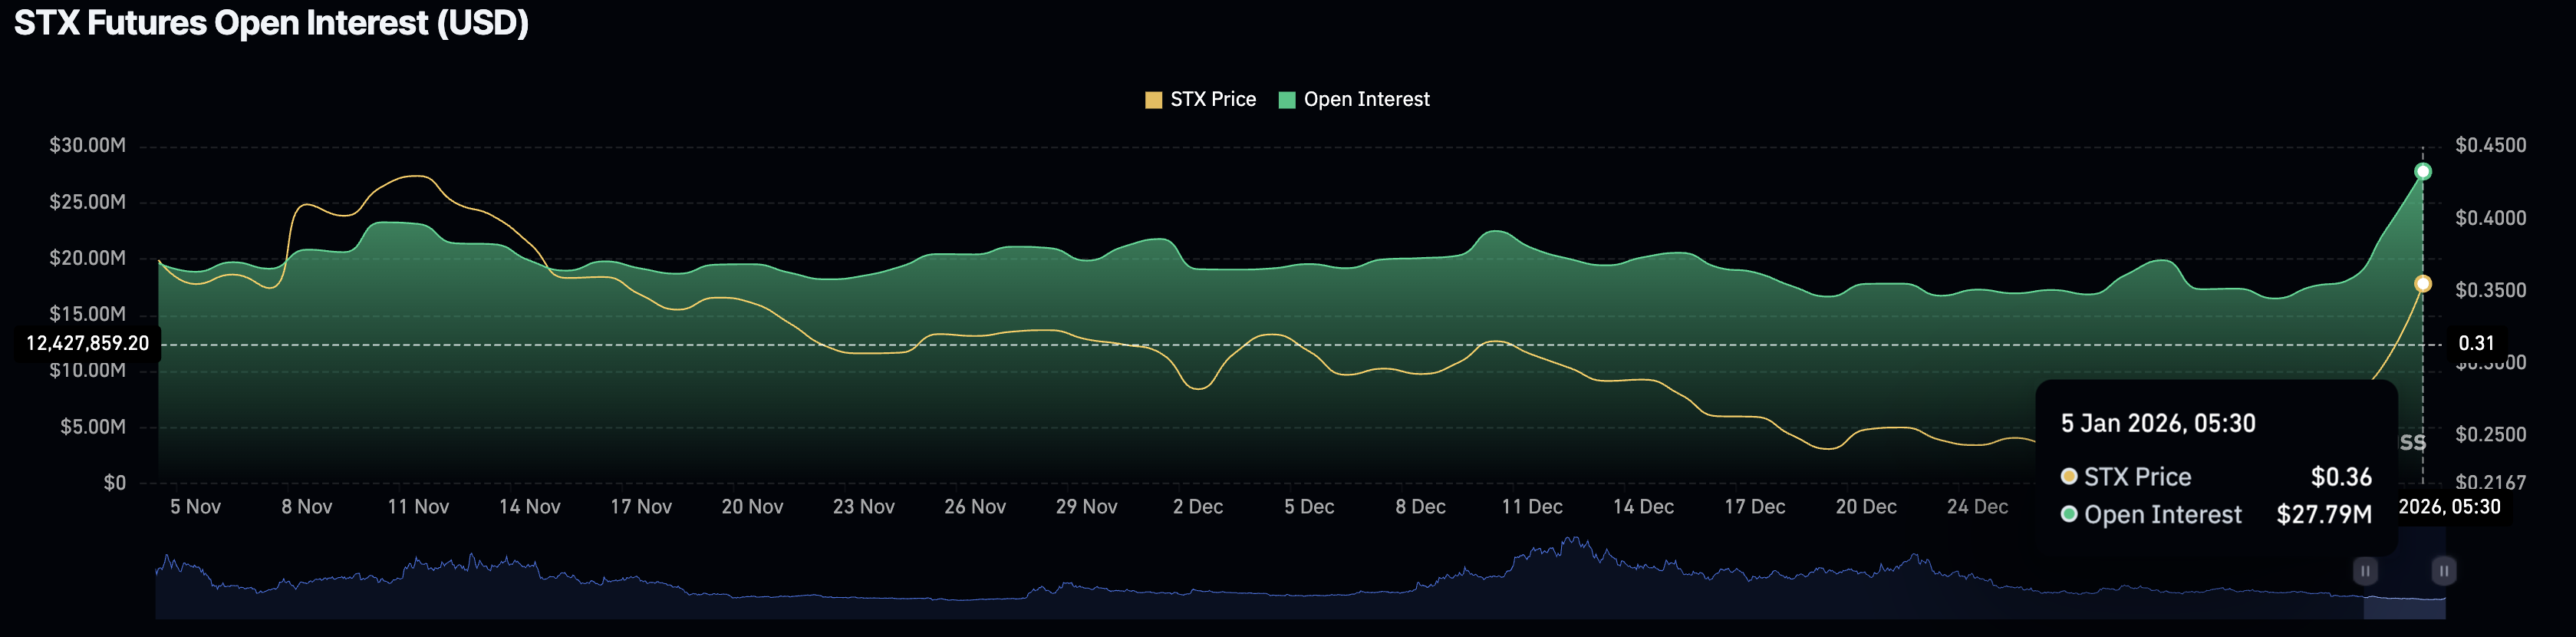
On the derivatives side, the Stacks futures Open Interest (OI) stands at $27.79 million, rising from $16.49 million on Thursday, suggesting a capital inflow driven by renewed risk-on sentiment among traders. Typically, an increase in OI during a price surge indicates a bullish incline in market sentiment.
Technical outlook: Will Stacks extend its rally to $0.50?
Stacks bounced off 17% from the 50-day Exponential Moving Average (EMA) at $0.3060 on Sunday. At the time of writing, the STX price is squeezed between the reclaimed $0.3400 demand zone and a declining trendline connecting the August 14 and September 19 highs, near $0.3500.
To further extend gains, STX should secure a daily close above $0.3500, which could target the supply zone close to the $0.5000 psychological level.
The Relative Strength Index (RSI) on the daily chart is at 69, suggesting heightened buying pressure. However, RSI often risks a downside reversal near the overbought boundary due to unsustainable pressure.
At the same time, the Moving Average Convergence Divergence (MACD) indicates a surge in bullish momentum, based on rising average lines and successively increasing green histogram bars.
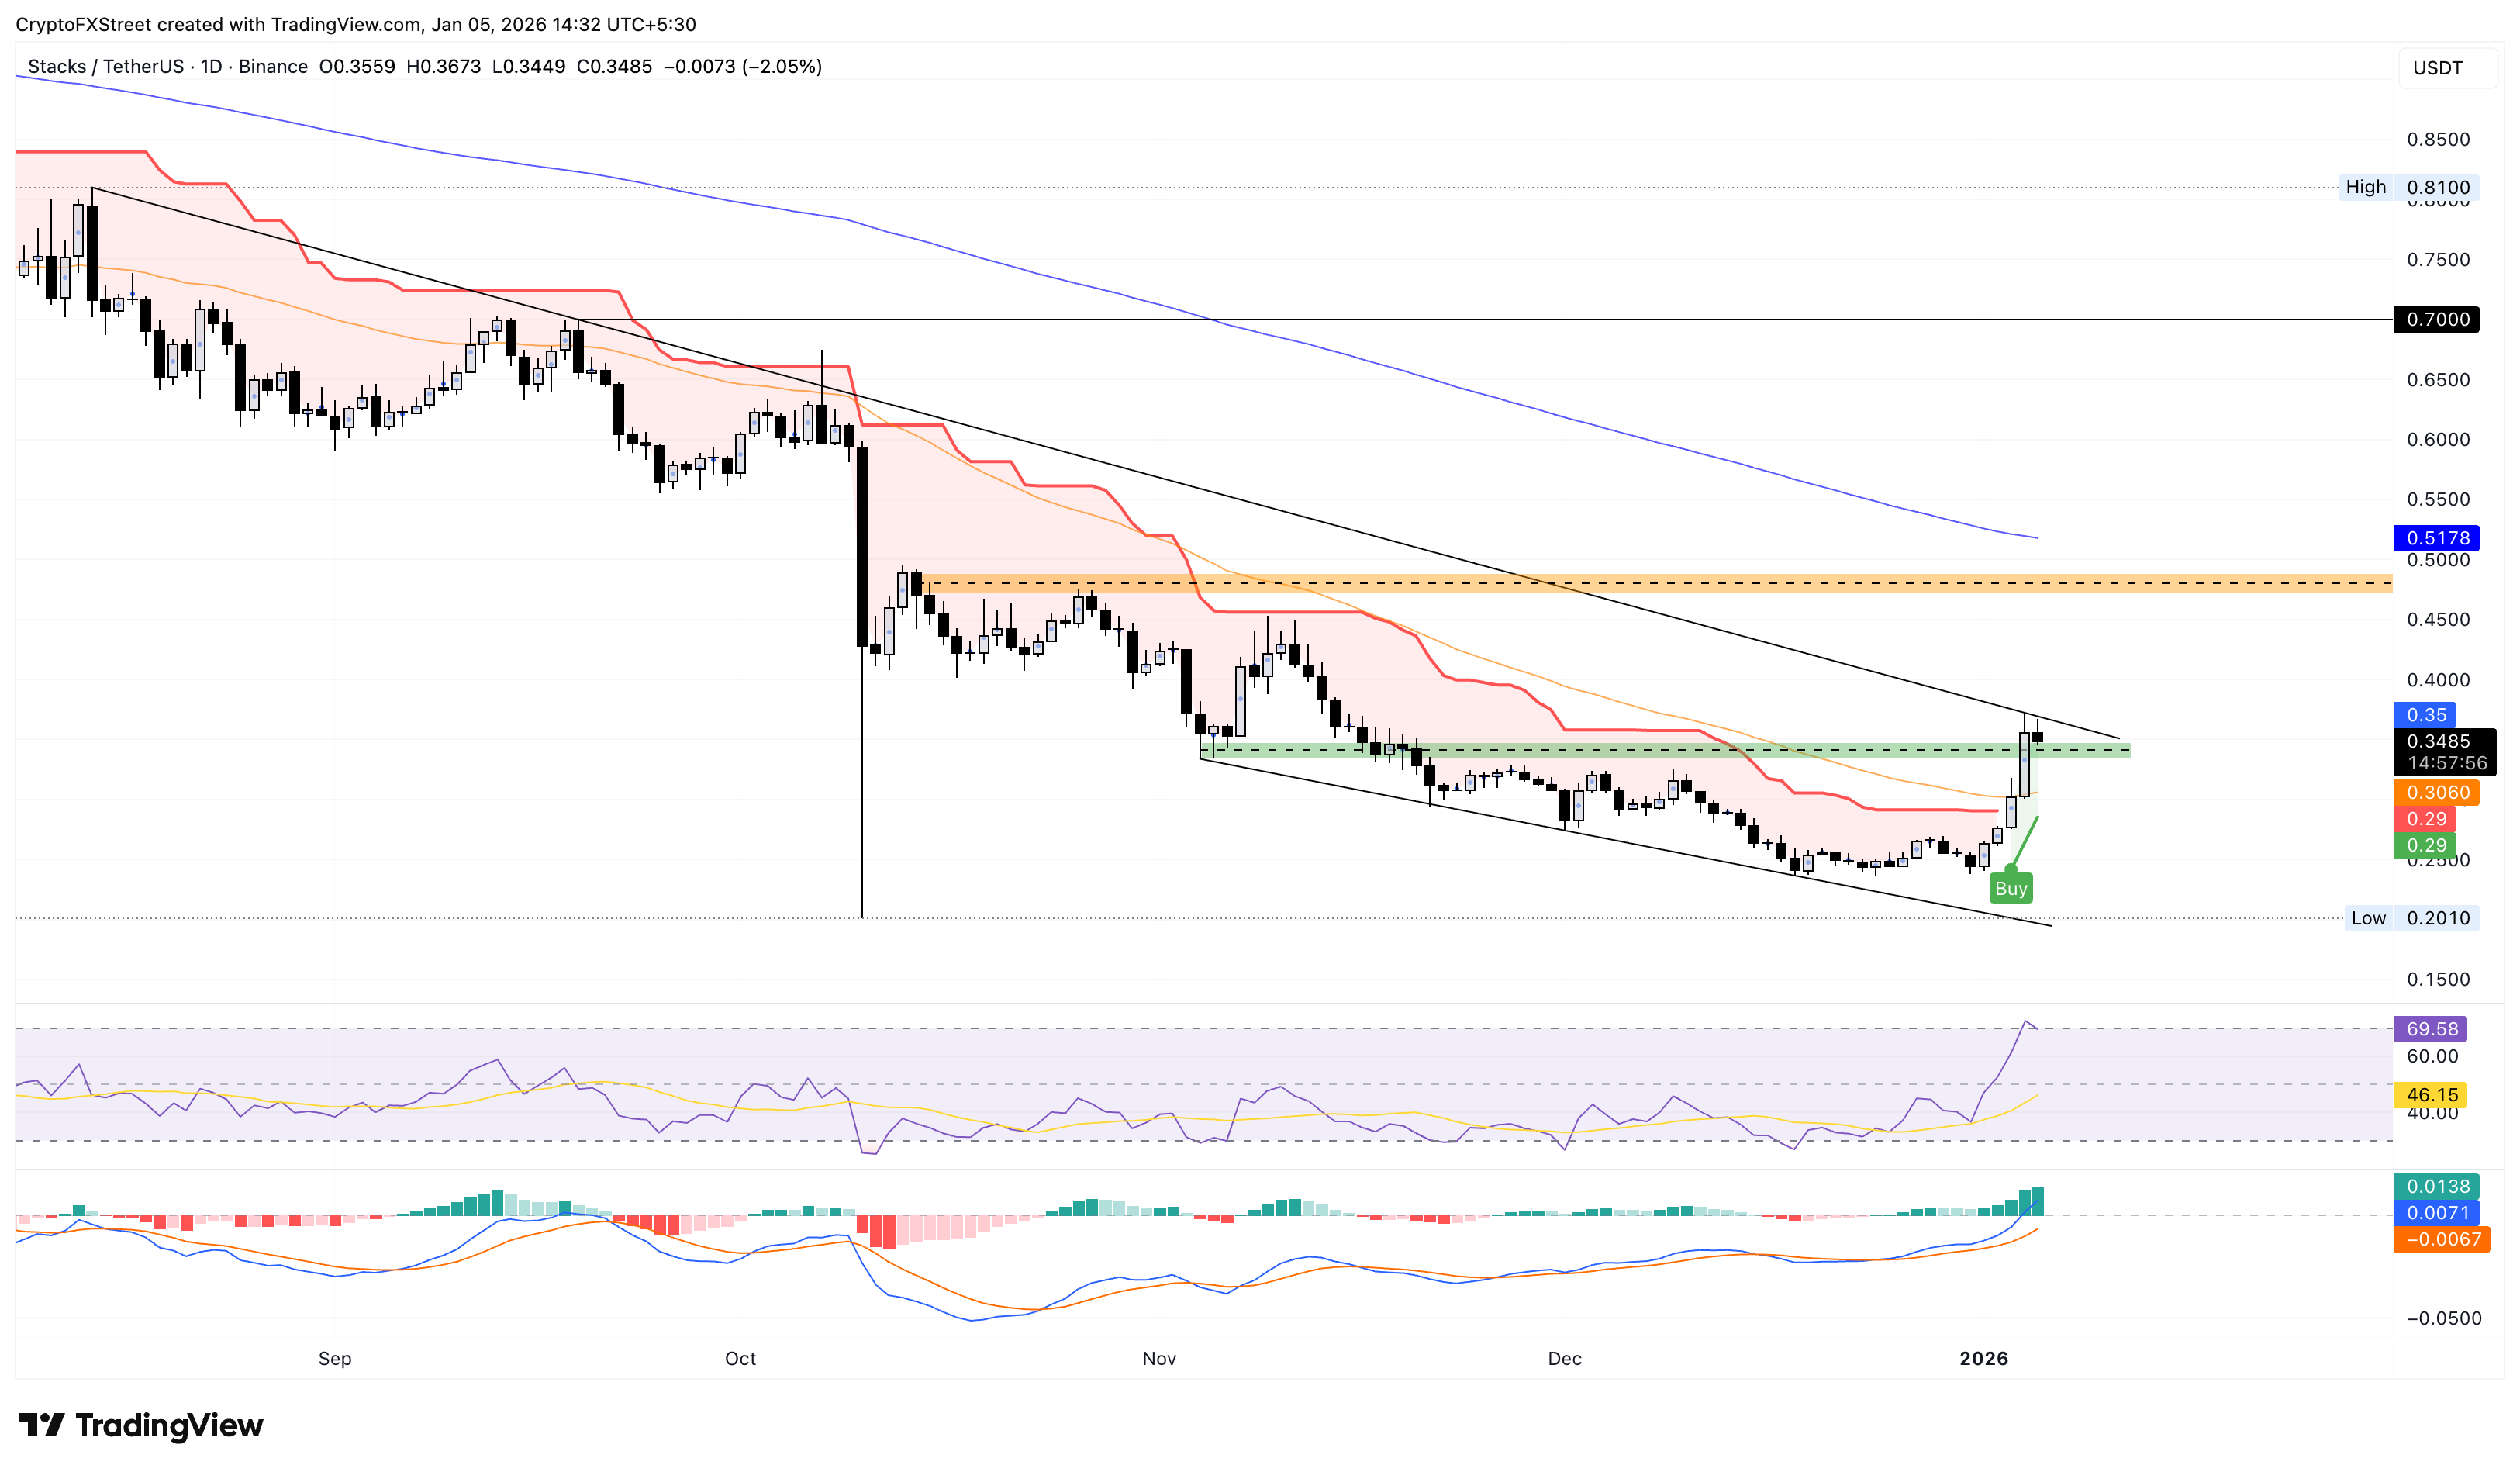
Looking down, if STX slips below $0.3400, it could test the 50-day EMA at $0.3060.
Author

Vishal Dixit
FXStreet
Vishal Dixit holds a B.Sc. in Chemistry from Wilson College but found his true calling in the world of crypto.


