Ripple gains momentum as ETF inflows and derivatives demand rise
- Ripple rises above the 50-day EMA as the broader cryptocurrency market expands bullish scope.
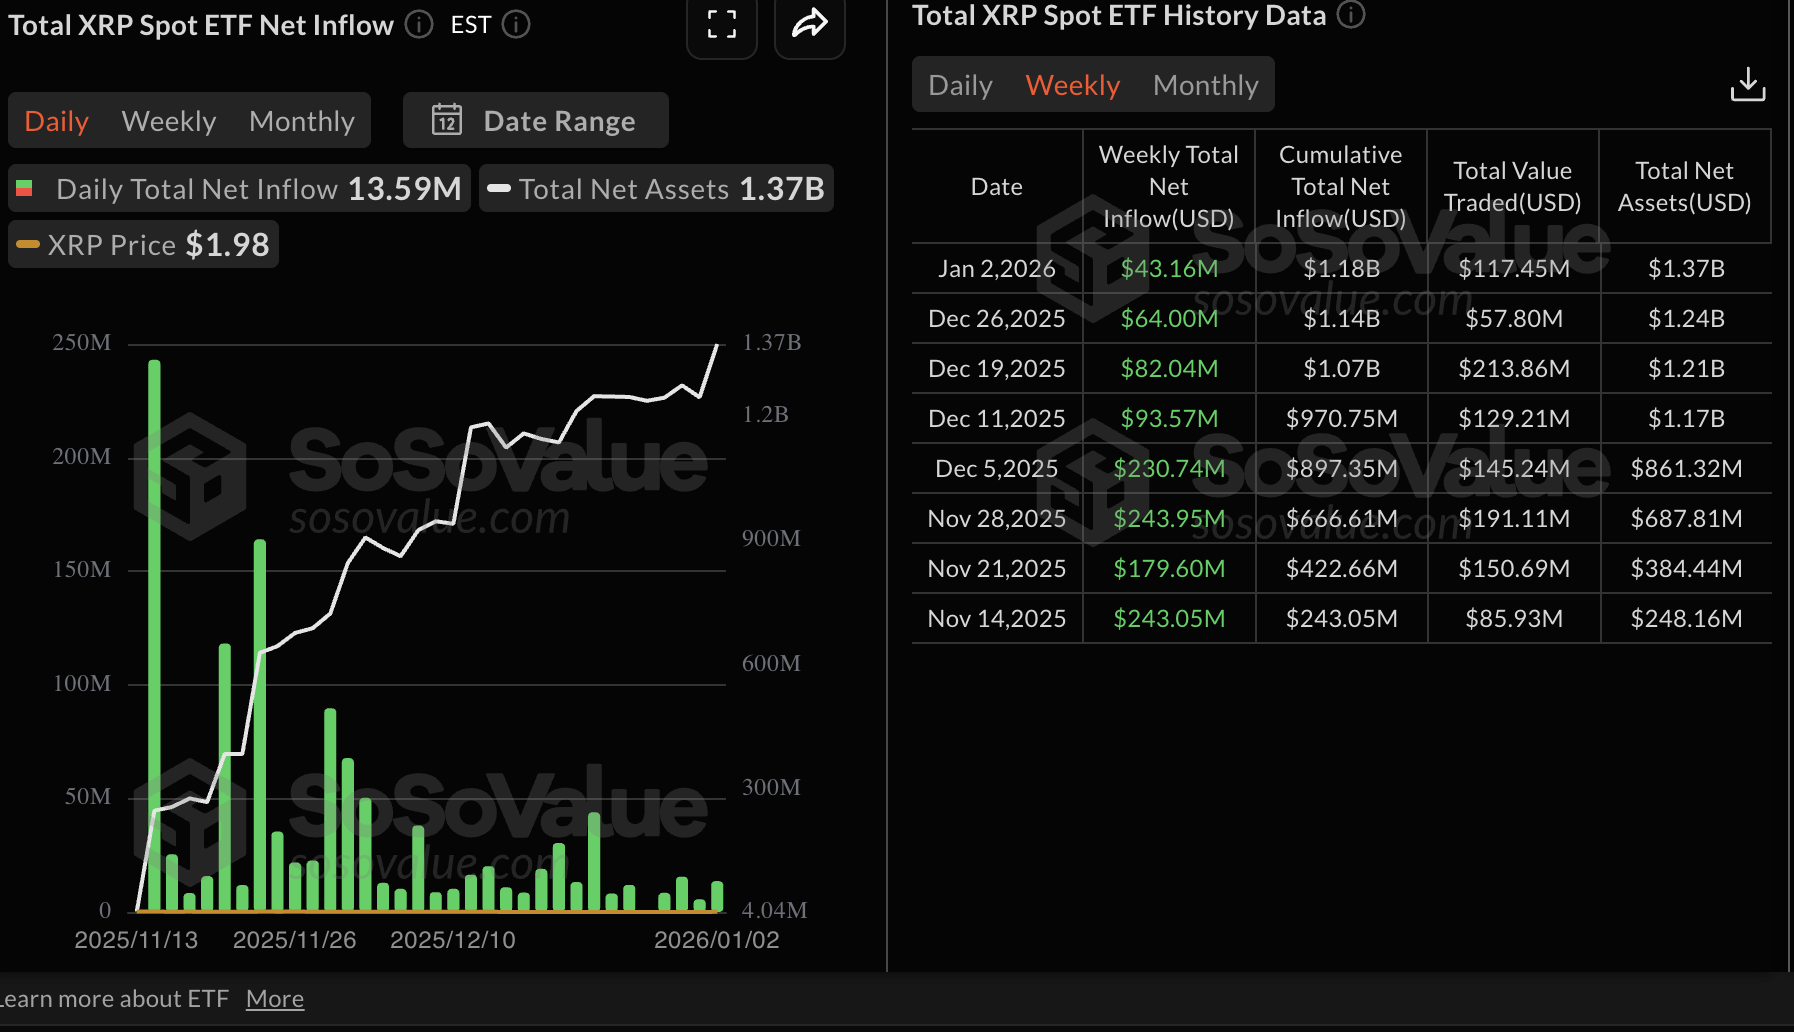
- XRP ETFs’ weekly inflow streak extends, drawing $43 million amid steady institutional demand.
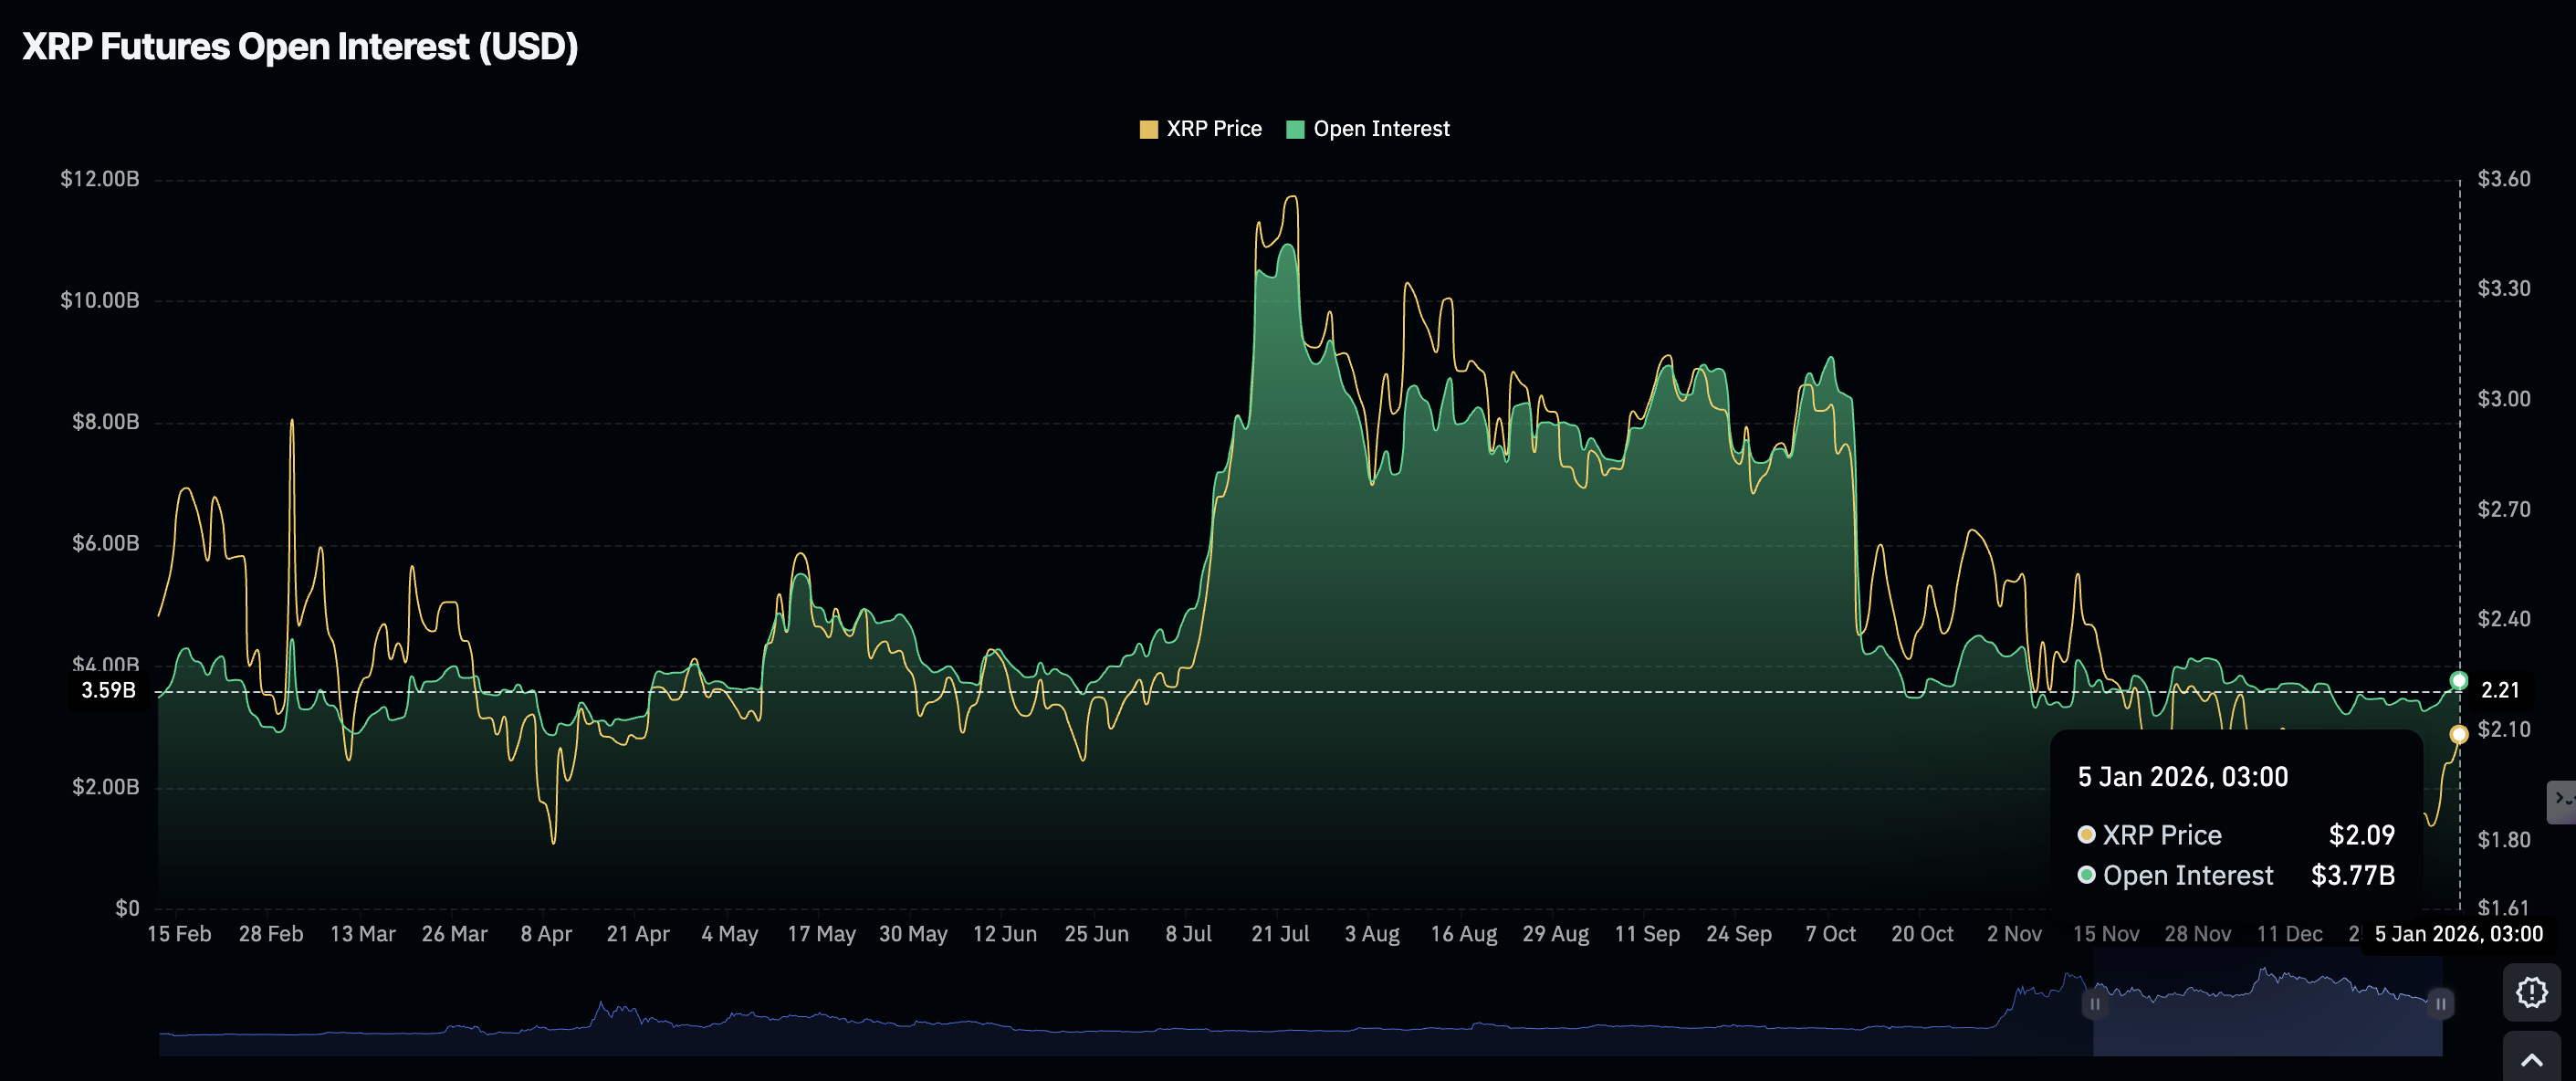
- The XRP derivatives market improves with futures Open Interest rising to $3.8 billion.

Ripple (XRP) edges up above $2.13 at the time of writing on Monday, reflecting steady interest in risk assets across the cryptocurrency market despite geopolitical tensions.
XRP is rising for the fifth consecutive day, supported by steady inflows into spot Exchange Traded Funds (ETFs). Retail interest in the cross-border remittance token shows signs of a gradual comeback, as evidenced by futures Open Interest (OI) rising to $3.8 billion.
Key milestones remain critical to the uptrend’s continuation, including a breakout above a multi-month trendline on the daily chart. On the other hand, a daily close below the pivotal $2.00 level could see XRP resume the downtrend amid rising volatility.
XRP holds steady amid institutional and retail growth
XRP spot ETFs listed in the United States (US) experienced inflows of $43 million last week. Since their debut in November, XRP ETFs have maintained steady weekly inflows, suggesting growing institutional investor interest.
SoSoValue data shows that the five ETF products recorded approximately $13.6 million in inflows on Friday, bringing the cumulative net inflow to $1.18 billion and net assets to $1.37 billion.
Meanwhile, the uptake of XRP derivatives continues to gradually improve, as evidenced by futures OI increasing to approximately $3.8 billion on Monday, up from $3.6 billion the previous day. The OI averaged $3.3 billion on Thursday, signaling that retail demand is making a comeback and may continue to support the uptrend in prices.
Technical outlook: XRP holds support ahead of a potential breakout
XRP is trading at $2.13 at the time of writing on Monday. The 50-day Exponential Moving Average (EMA) provides support at $2.05, which suggests that bulls have a slight edge over bears.
The Moving Average Convergence Divergence (MACD) indicator upholds a positive outlook on the daily chart, with green histogram bars expanding above the mean line. Moreover, the blue MACD line sits above the red signal line, suggesting strengthening bullish momentum.
Similarly, the Relative Strength Index (RSI) at 65 and rising supports XRP's bullish thesis. A further increase of the RSI into overbought territory would boost the odds of a breakout above the moving average cluster, represented by the 100-day EMA at $2.22 and the 200-day EMA at $2.34.
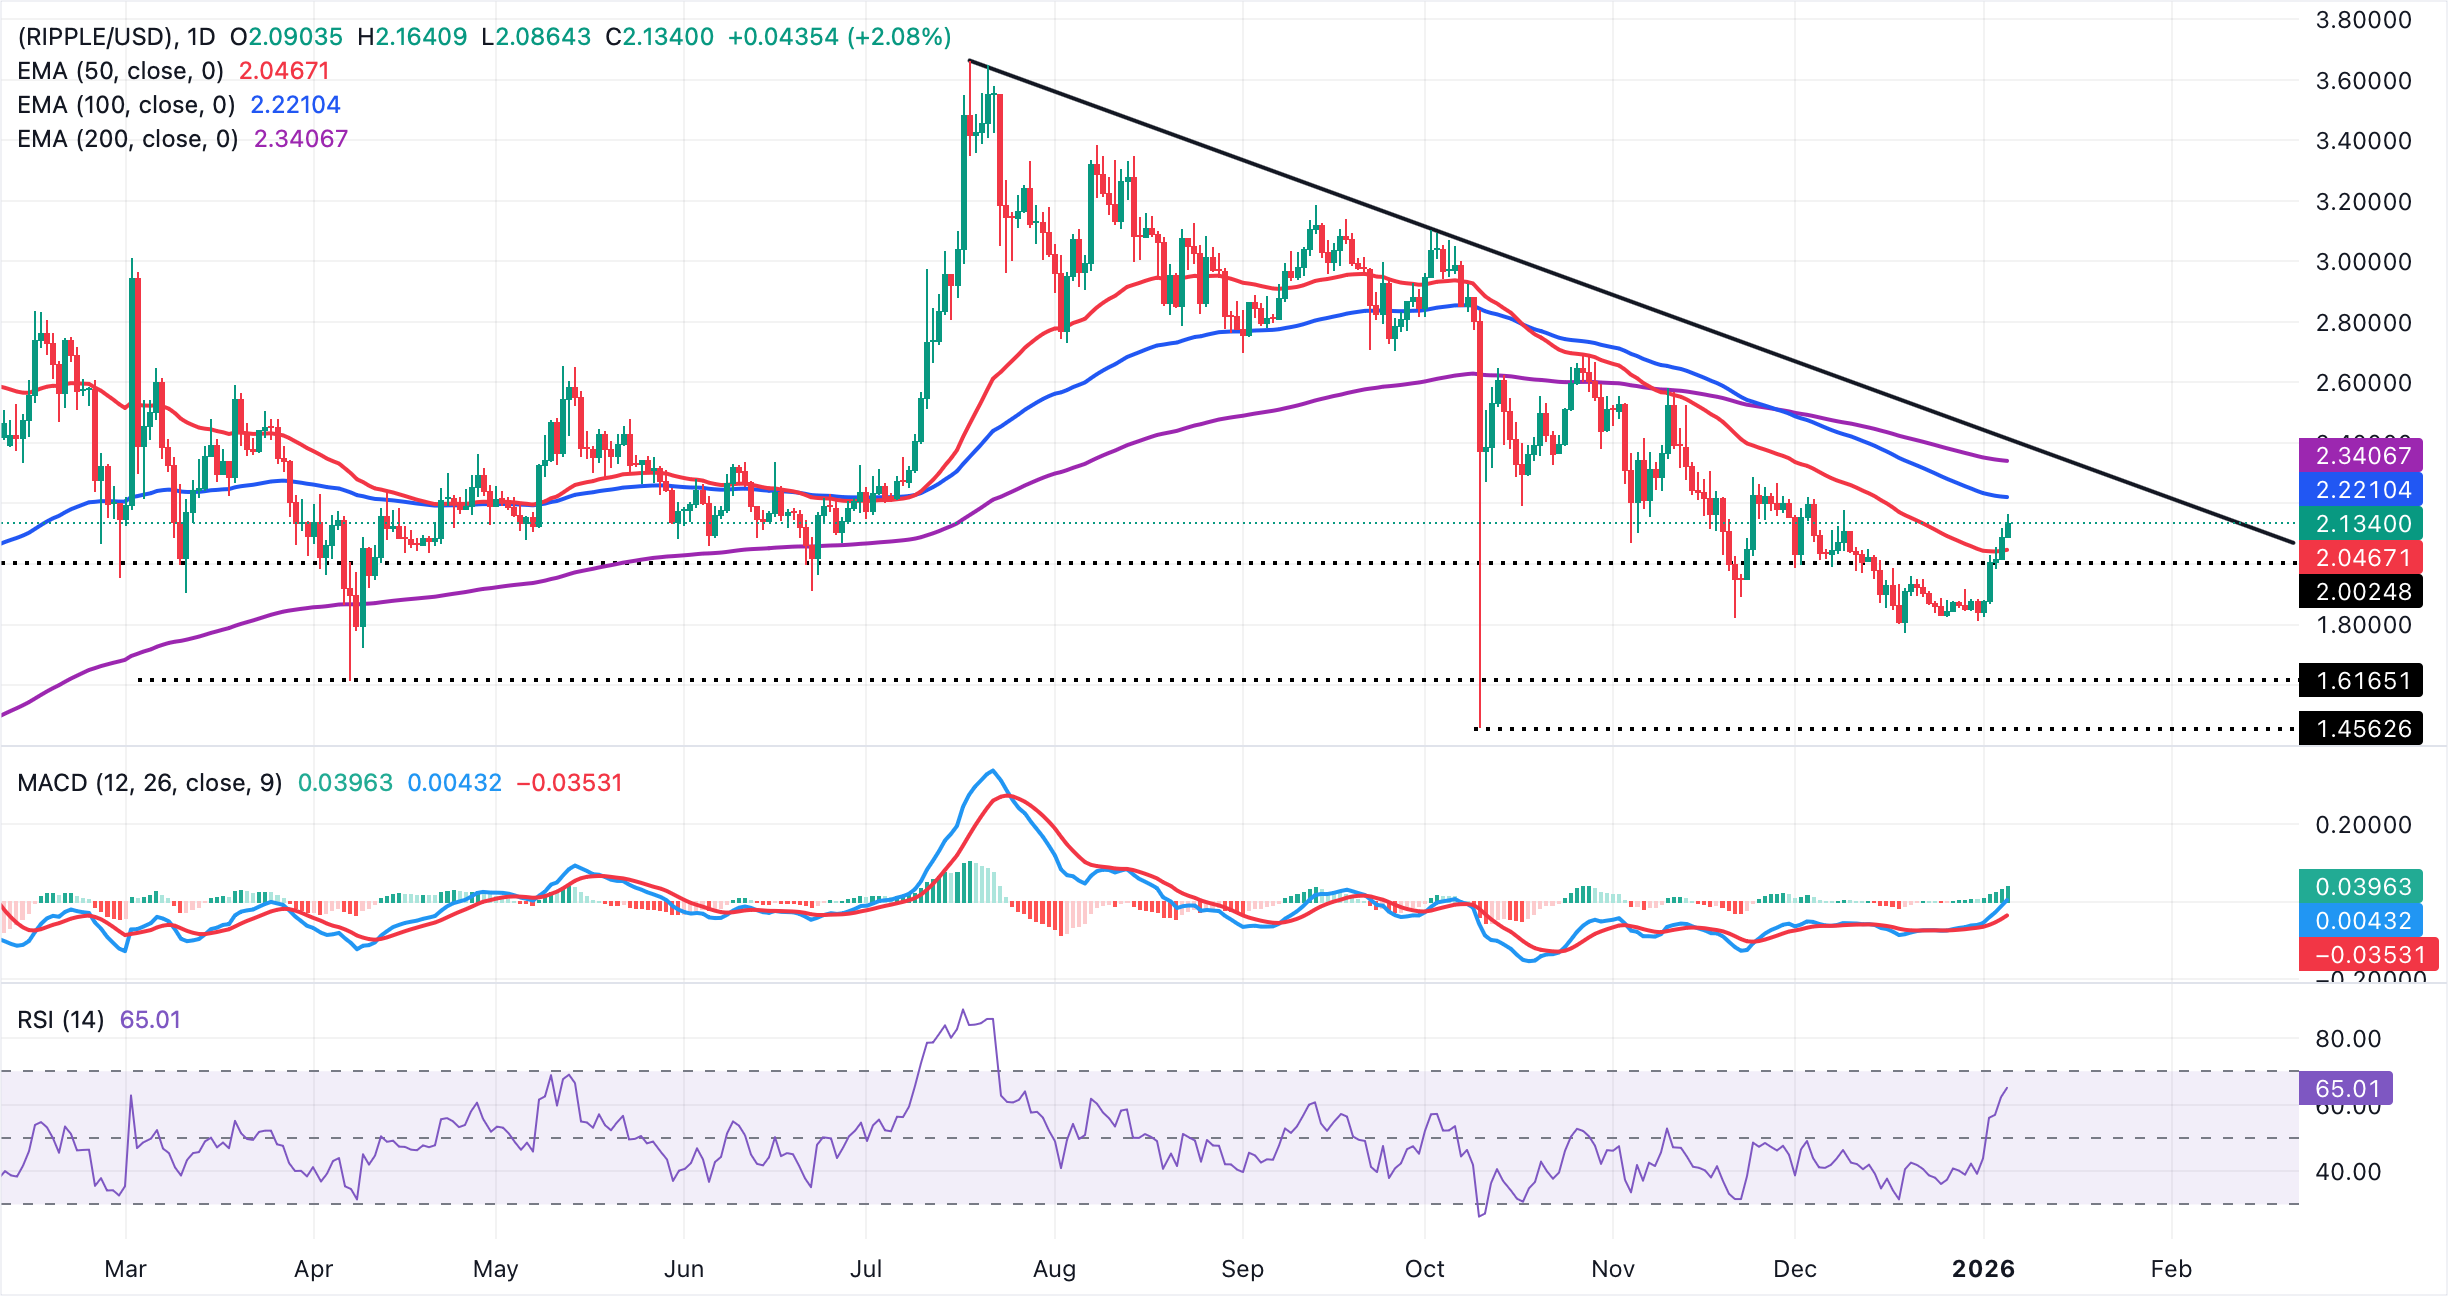
A descending trend line from $3.66 record high limits the advance, with resistance seen near $2.41. A daily close above the 100-day EMA would open the door toward the 200-day EMA barrier, reinforcing a recovery phase, while the 50-day EMA underpins pullbacks to keep the bounce intact.
Failure to clear the trend line and the 100-day EMA cap would leave the broader bias heavy and risk a return to consolidation or an extended decline below the $2.00 level.
Open Interest, funding rate FAQs
Higher Open Interest is associated with higher liquidity and new capital inflow to the market. This is considered the equivalent of increase in efficiency and the ongoing trend continues. When Open Interest decreases, it is considered a sign of liquidation in the market, investors are leaving and the overall demand for an asset is on a decline, fueling a bearish sentiment among investors.
Funding fees bridge the difference between spot prices and prices of futures contracts of an asset by increasing liquidation risks faced by traders. A consistently high and positive funding rate implies there is a bullish sentiment among market participants and there is an expectation of a price hike. A consistently negative funding rate for an asset implies a bearish sentiment, indicating that traders expect the cryptocurrency’s price to fall and a bearish trend reversal is likely to occur.
(The technical analysis of this story was written with the help of an AI tool)
Author

John Isige
FXStreet
John Isige is a seasoned cryptocurrency journalist and markets analyst committed to delivering high-quality, actionable insights tailored to traders, investors, and crypto enthusiasts. He enjoys deep dives into emerging Web3 tren


