VeChain Price Analysis: VET breakout explores open-air toward the beckoning $0.06
- VeChain has renewed the bullish outlook with gains eyeing $0.06 in the wake of a technical breakout.
- The upswing to new record highs will be validated on stepping above the 38.2% Fibonacci level and the 50 SMA.
- Overhead pressure could create a wall at $0.045, delaying the anticipated liftoff.

VeChain has lifted off the recent support at $0.0.35. The bullish momentum increased in intensity after stepping above the 200 Simple Moving Average (SMA) on the 4-hour chart. Gains are likely to continue, especially after the VET broke above descending trendline resistance.
VeChain eyes a 44% upswing toward $0.06
VeChain is on an upward roll after breaking above a descending triangle. Usually, this pattern is bearish, but there are instances when the negative outlook is ignored in favor of a breakout. For instance, VET is dancing at $0.043 at the time of writing after rising past the triangle’s upper trendline.
Minor resistance at the 50 Simple Moving Average (SMA) will have to come down for VeChain to continue with the uptrend. However, the real test will be stepping beyond the hurdle highlighted by the 38.2% Fibonacci retracement level taken between the last swing high of $0.061 and $0.035. The rest of the journey to $0.06 will occur on account of the triangle breakout.
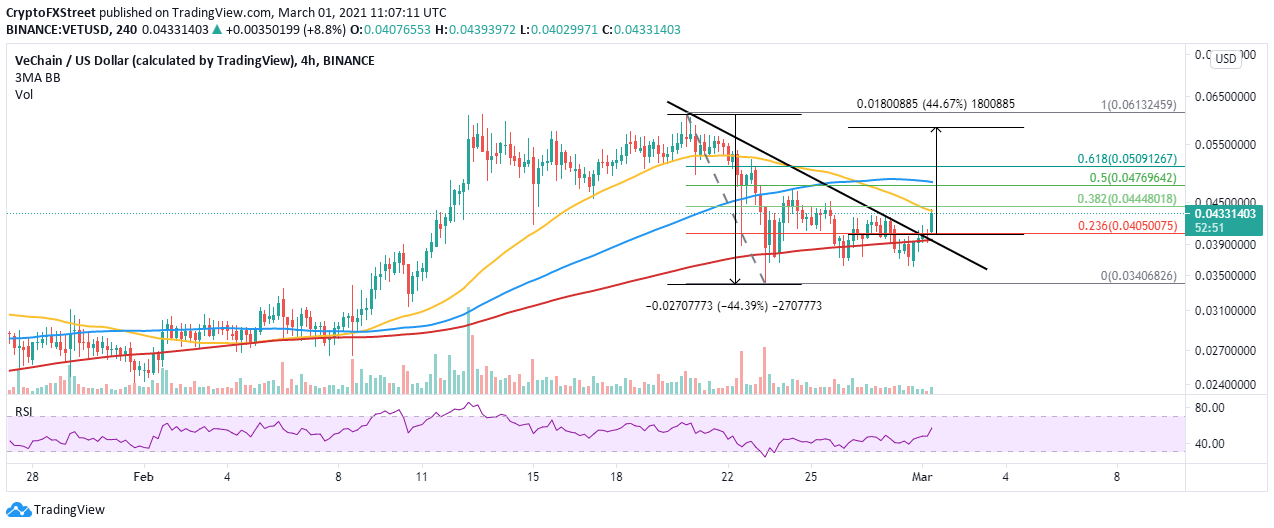
VET/USD 4-hour chart
An inverse head-and-shoulders (H&S) pattern on the daily chart brings to light the possibility of a 95% rally. Initially, VeChain broke above the neckline but hit a snag at $0.061 (all-time highs). Following the rejection, the price tested the neckline support and is on the verge of another rally to a new record higher. The inverse H&S pattern is massively bullish in technical analysis.
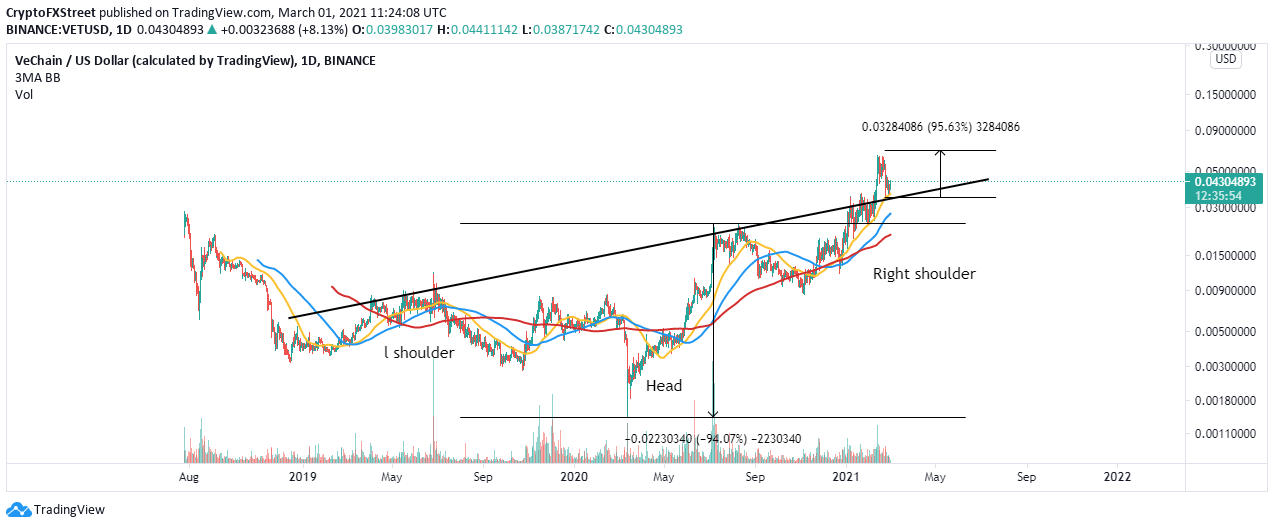
VET/USD daily chart
Looking at the other side of the fence
The confluence resistance highlighted by the 50 SMA and the 38.2% Fibonacci level on the 4-hour chart must be broken for gains toward $0.06. However, if the selling pressure remains unshaken, VeChain will cancel the rally and begin to search for another formidable support. The 23.6% level is in line to offer anchorage in a downswing from the current price levels.
Author

John Isige
FXStreet
John Isige is a seasoned cryptocurrency journalist and markets analyst committed to delivering high-quality, actionable insights tailored to traders, investors, and crypto enthusiasts. He enjoys deep dives into emerging Web3 tren


