Vechain Elliott Wave technical analysis [Video]
![Vechain Elliott Wave technical analysis [Video]](https://editorial.fxsstatic.com/images/i/crypto-02_XtraLarge.jpg)
VET/USD – Elliott Wave technical analysis
-
Function: Counter Trend.
-
Mode: Corrective.
-
Structure: Double Corrective.
-
Position: Wave Y.
-
Next directional move (higher degrees): Awaiting development.
-
Invalidation level: Not specified.
Trading strategy overview – Daily chart
VeChain (VETUSD) experienced a strong upward move from around $0.0212 in early April, establishing a clear wave I formation. The current structure indicates the start of a wave II corrective phase, likely forming a Double Zigzag.
Strategy points
- For Swing Traders (Short-Term):
Watch for wave Y to end in the $0.020–$0.021 area. A long position can be considered to ride wave III. - Risk Management:
If the price dips below $0.017, the current wave count may be invalid, requiring structural reassessment.

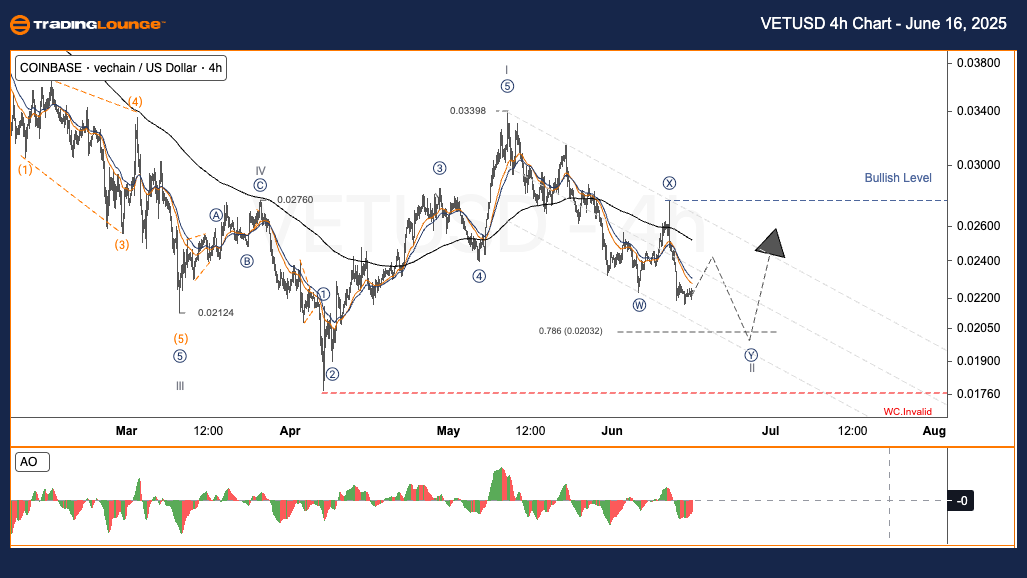
VET/USD – Elliott Wave technical analysis
-
Function: Counter Trend.
-
Mode: Corrective.
-
Structure: Double Corrective.
-
Position: Wave Y.
-
Next directional move (higher degrees): Awaiting development.
-
Invalidation level: Not specified.
Trading strategy overview – Four-hour chart
As observed in the Daily Chart, VETUSD has likely completed a wave I and is undergoing a wave II correction via a Double Zigzag. Similar strategy guidance applies here:
Strategy points
- Swing trade opportunity:
Entry near $0.020–$0.021 to catch the beginning of wave III upward. - Critical level:
If the market breaks below $0.017, the Elliott structure becomes invalid.
Vechain Elliott Wave technical analysis [Video]
Author

Peter Mathers
TradingLounge
Peter Mathers started actively trading in 1982. He began his career at Hoei and Shoin, a Japanese futures trading company.


