VeChain Elliott Wave technical analysis [Video]
![VeChain Elliott Wave technical analysis [Video]](https://editorial.fxstreet.com/images/Markets/Currencies/Cryptocurrencies/VeChain/vechain-150x150logo-637399983192838290.png)
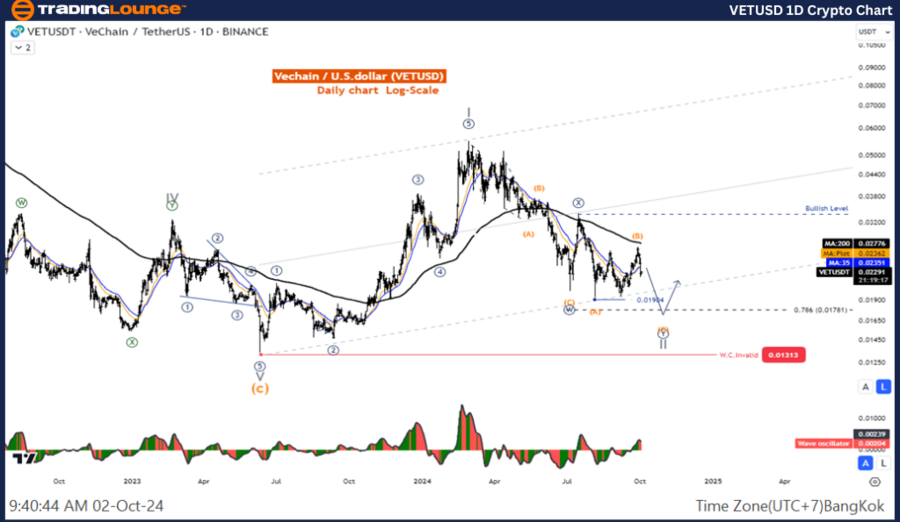
Elliott Wave Analysis TradingLounge daily chart.
VET/USD Elliott Wave technical analysis
Function: Counter trend.
Mode: Corrective.
Structure: Double Corrective.
Position: Wave ((Y)).
Direction next higher degrees: Wave II of Impulse.
Details: Wave II may not be complete, price is likely to be below 0.01781.
VeChain/ U.S. dollar(VETUSD)Trading Strategy: The rise from 0.01904 has a corrective nature, so there is a possibility that the correction is not over yet, watch out for a retracement below 0.01904.
VeChain/ U.S. dollar(VETUSD)Technical Indicators: The price is below the MA200 indicating a Downtrend, The Wave Oscillator is a Bearish Momentum.
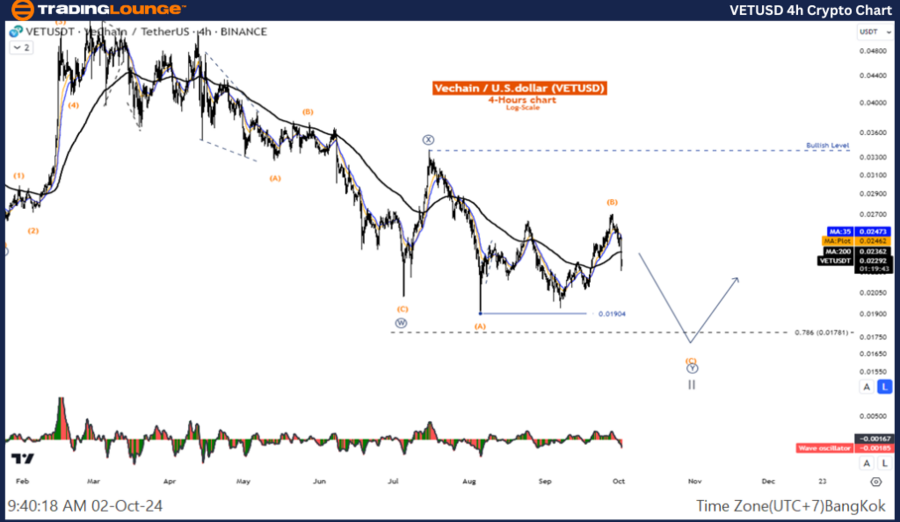
VeChain/ U.S. dollar(VETUSD) four-our chart
VET/USD Elliott Wave technical analysis
Function: Counter trend
Mode: Corrective
Structure: Double Corrective
Position: Wave ((Y))
Direction next higher degrees: wave II of Impulse
Details: Wave II may not be complete, price is likely to be below 0.01781.
VeChain/US Dollar (VETUSD) Trading Strategy: The rise from 0.01904 has a corrective nature, so there is a possibility that the correction is not over yet, watch out for a retracement below 0.01904.
VeChain/US Dollar(VETUSD)Technical Indicators: The price is below the MA200 indicating a Downtrend, The Wave Oscillator is a Bearish Momentum.
VeChain Elliott Wave technical analysis [Video]
Author

Peter Mathers
TradingLounge
Peter Mathers started actively trading in 1982. He began his career at Hoei and Shoin, a Japanese futures trading company.


