VeChain break above descending trendline sparks rally speculation
- VeChain price breaks above the descending trendline, suggesting a bullish move.
- Sideline buyers can accumulate VET between $0.0247 and $0.0239.
- A daily candlestick close below $0.0204 would invalidate the bullish thesis.

VeChain (VET) price broke above a descending trendline earlier this week, suggesting a bullish trend ahead, and consolidates around 0.0263 on Friday. Potential buyers on the sidelines may consider accumulating VET from $0.0247 to $0.0239 before anticipating an upward rally in the coming days.
VeChain price shows potential for a rally
VeChain price broke above the descending trendline, drawn by joining multiple swing highs from June 7 to July 8, on Tuesday and rallied 4% in the next two days.
Sideline buyers looking for opportunities can wait for a pullback to the trendline breakout zone between $0.0247 and $0.0239.
If VET finds support around the trendline breakout zone, it could rally 24% to retest the 61.8% Fibonacci retracement level at $0.0303, measured from its swing high of $0.0366 on June 6 to its swing low of $0.0201 on July 5.
The Relative Strength Index (RSI) indicator on the daily chart is breaking above the neutral level of 50, while the Awesome Oscillator (AO) is on its way to doing the same. If bulls are indeed making a comeback, then both momentum indicators must maintain their positions above their respective mean levels. Such a development would add a tailwind to the recovery rally.
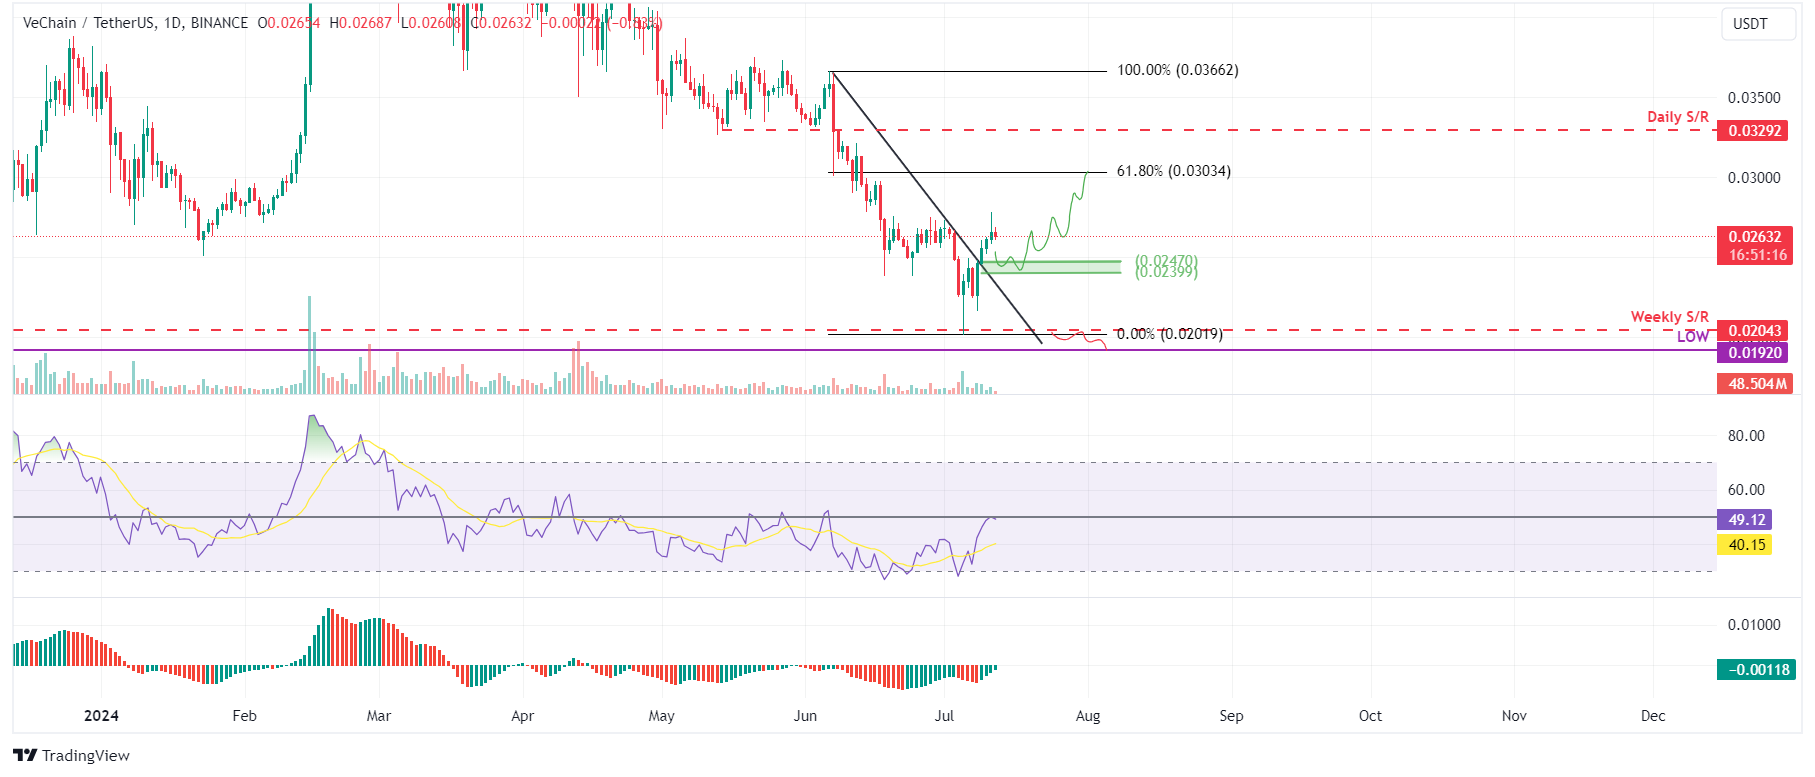
VET/USDT daily chart
However, if VET’s daily candlestick closes below $0.0204, the weekly support level, the bullish thesis would be invalidated by producing a lower low on a daily timeframe. This development could see VeChain's price fall 6% to revisit the November 22, 2023 low of $0.0192.
Author

Manish Chhetri
FXStreet
Manish Chhetri is a crypto specialist with over four years of experience in the cryptocurrency industry.


