Uniswap Price Prediction: UNI at risk of a major correction to $16, on-chain metrics suggest
- Uniswap price had a massive 350% rally in 2021, reaching a high of $20.75.
- The digital asset could be poised for a correction as it is overextended.
- Several on-chain metrics suggest UNI is bound to see a pullback sooner than later.

Uniswap has reached a market capitalization of over $5.5 billion and has been climbing the ranks of CoinMarketCap to hit 13th. UNI was up by more than 1,000% since its all-time low of $1.75 in November 2020.
Uniswap price can quickly fall towards $16
The MVRV (7d) indicates that Uniswap price has been inside the risk zone for the past week. This often leads to a correction in the short-term, as it happened on January 30 or January 18.
%20[13.20.54,%2002%20Feb,%202021]-637478657559133427.png)
UNI MVRV (7d)
Even more worrying for the bulls is the percentage of UNI tokens inside exchanges, which had a significant spike from 6.3% on January 30 to 6.64% currently. This indicates that perhaps investors are ready to sell and take some profits in the short term.
%20[13.20.43,%2002%20Feb,%202021]-637478657587586197.png)
UNI tokens on exchanges
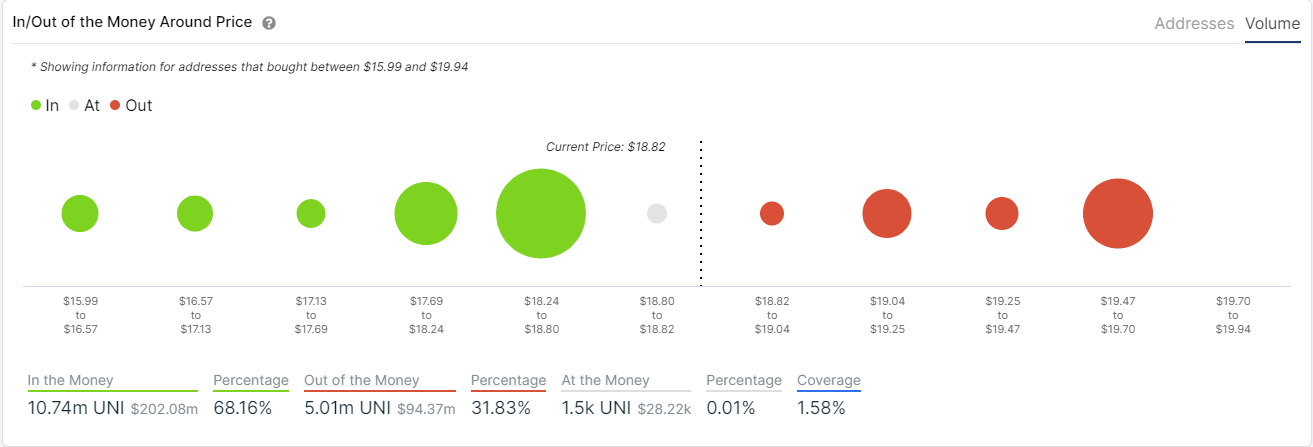
The In/Out of the Money Around Price (IOMAP) chart shows a robust support level between $18.24 and $18.8, where 122 addresses purchased 7.22 million UNI tokens. A breakdown below this point can drive Uniswap price down to $16 as there is weaker support below.
UNI IOMAP chart
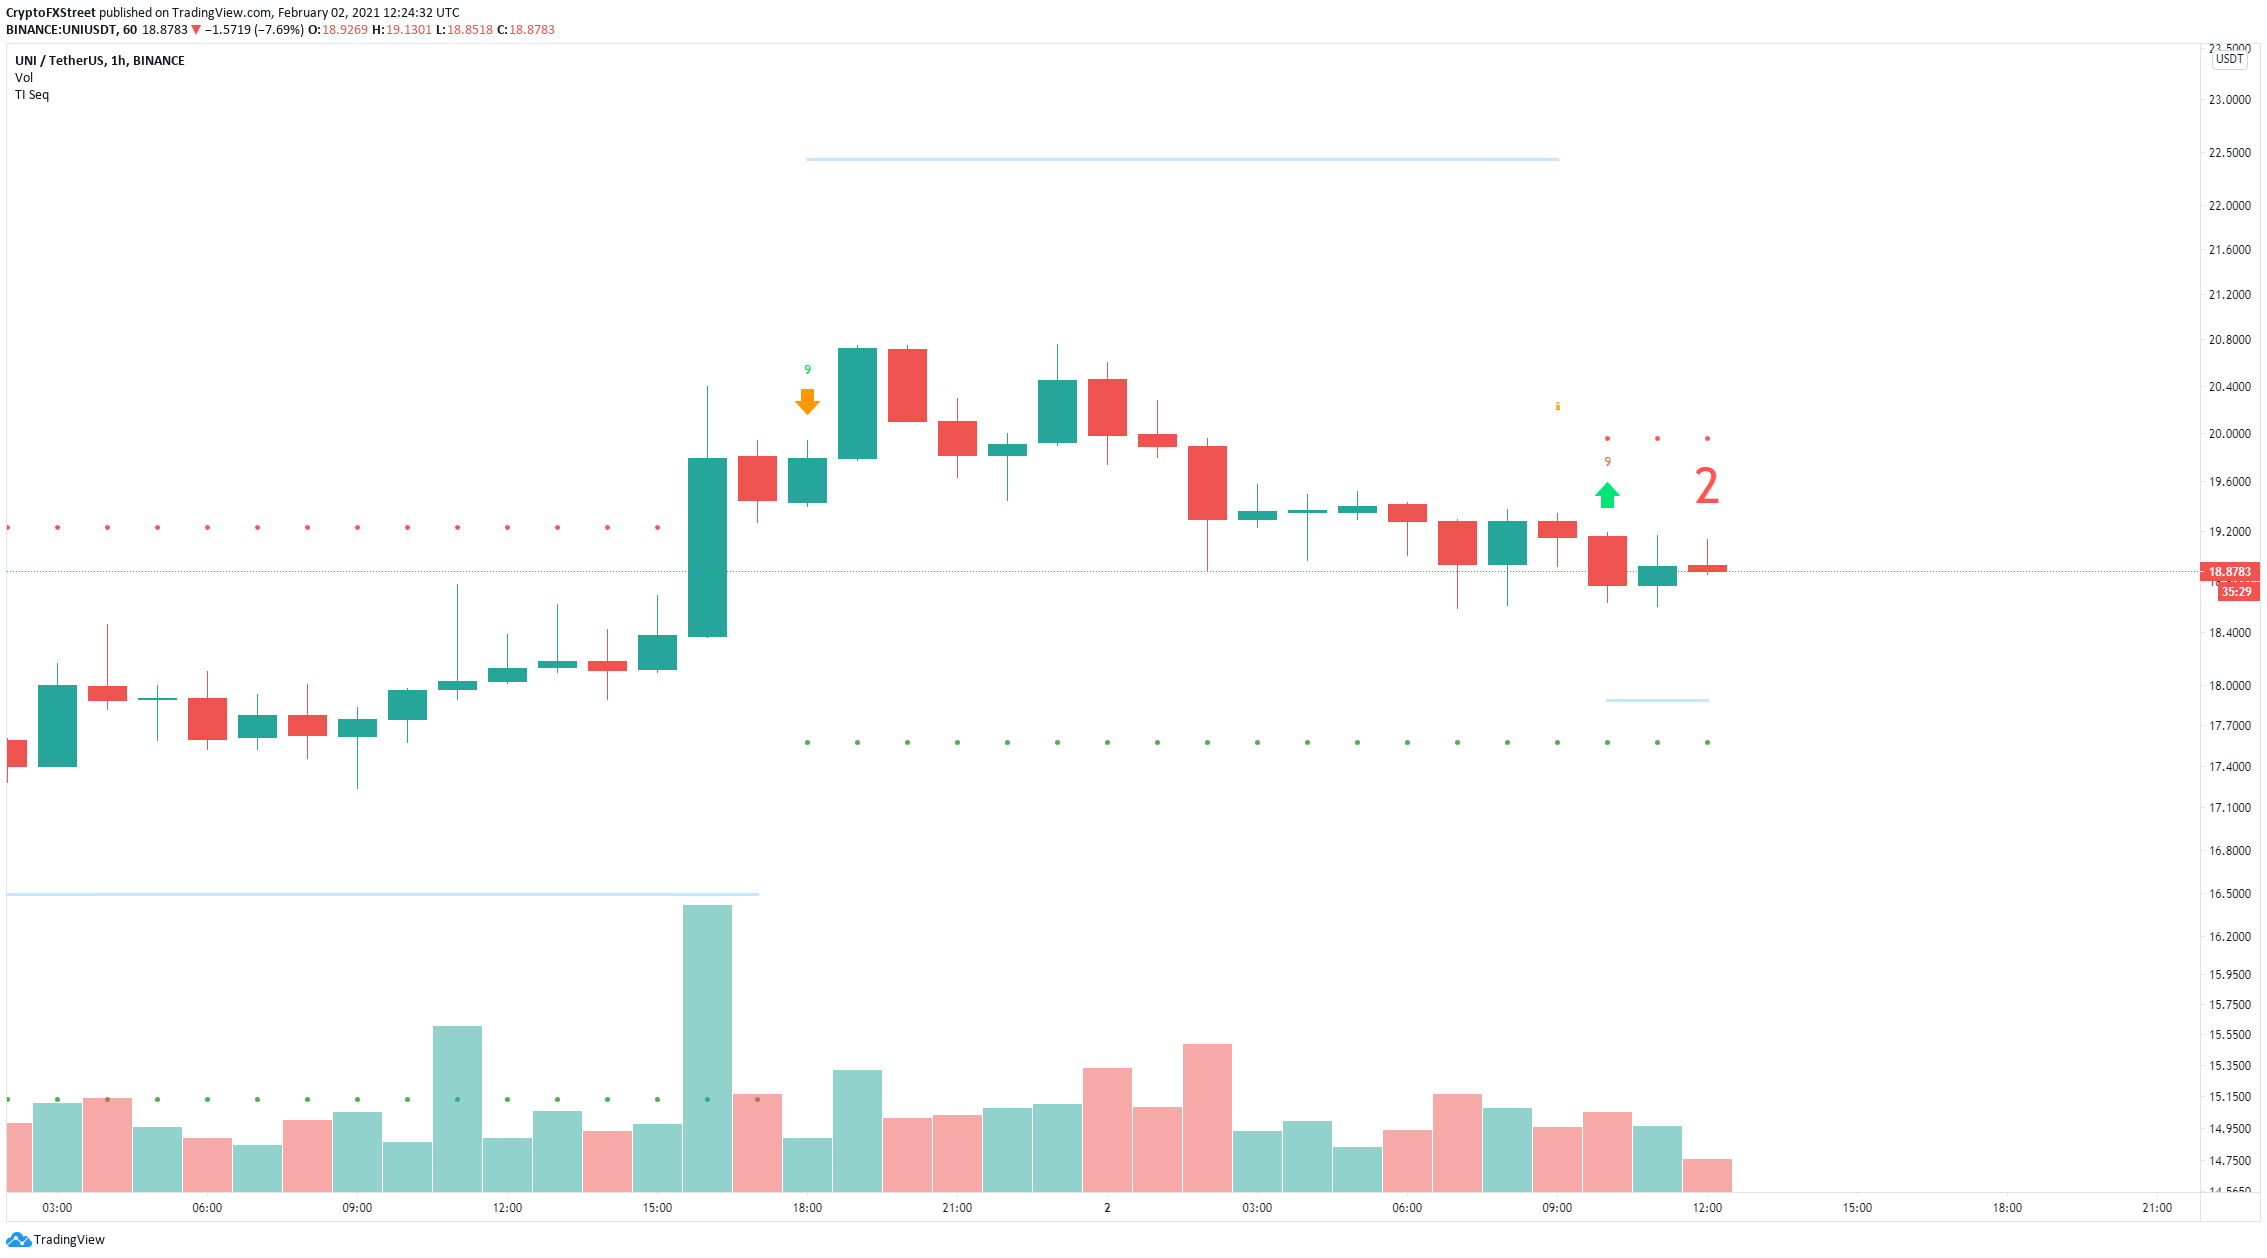
However, Uniswap is inside a major uptrend and could continue climbing higher. On the 1-hour chart, the TD Sequential indicator has presented a buy signal that could push Uniswap price towards $20 again.
UNI/USD 1-hour chart
According to the IOMAP chart, there is feeble resistance until the area between $19.47 and $19.7 with 3.55 million UNI in volume. A breakout above this point can easily drive Uniswap price above $20.
UNI/USD daily chart
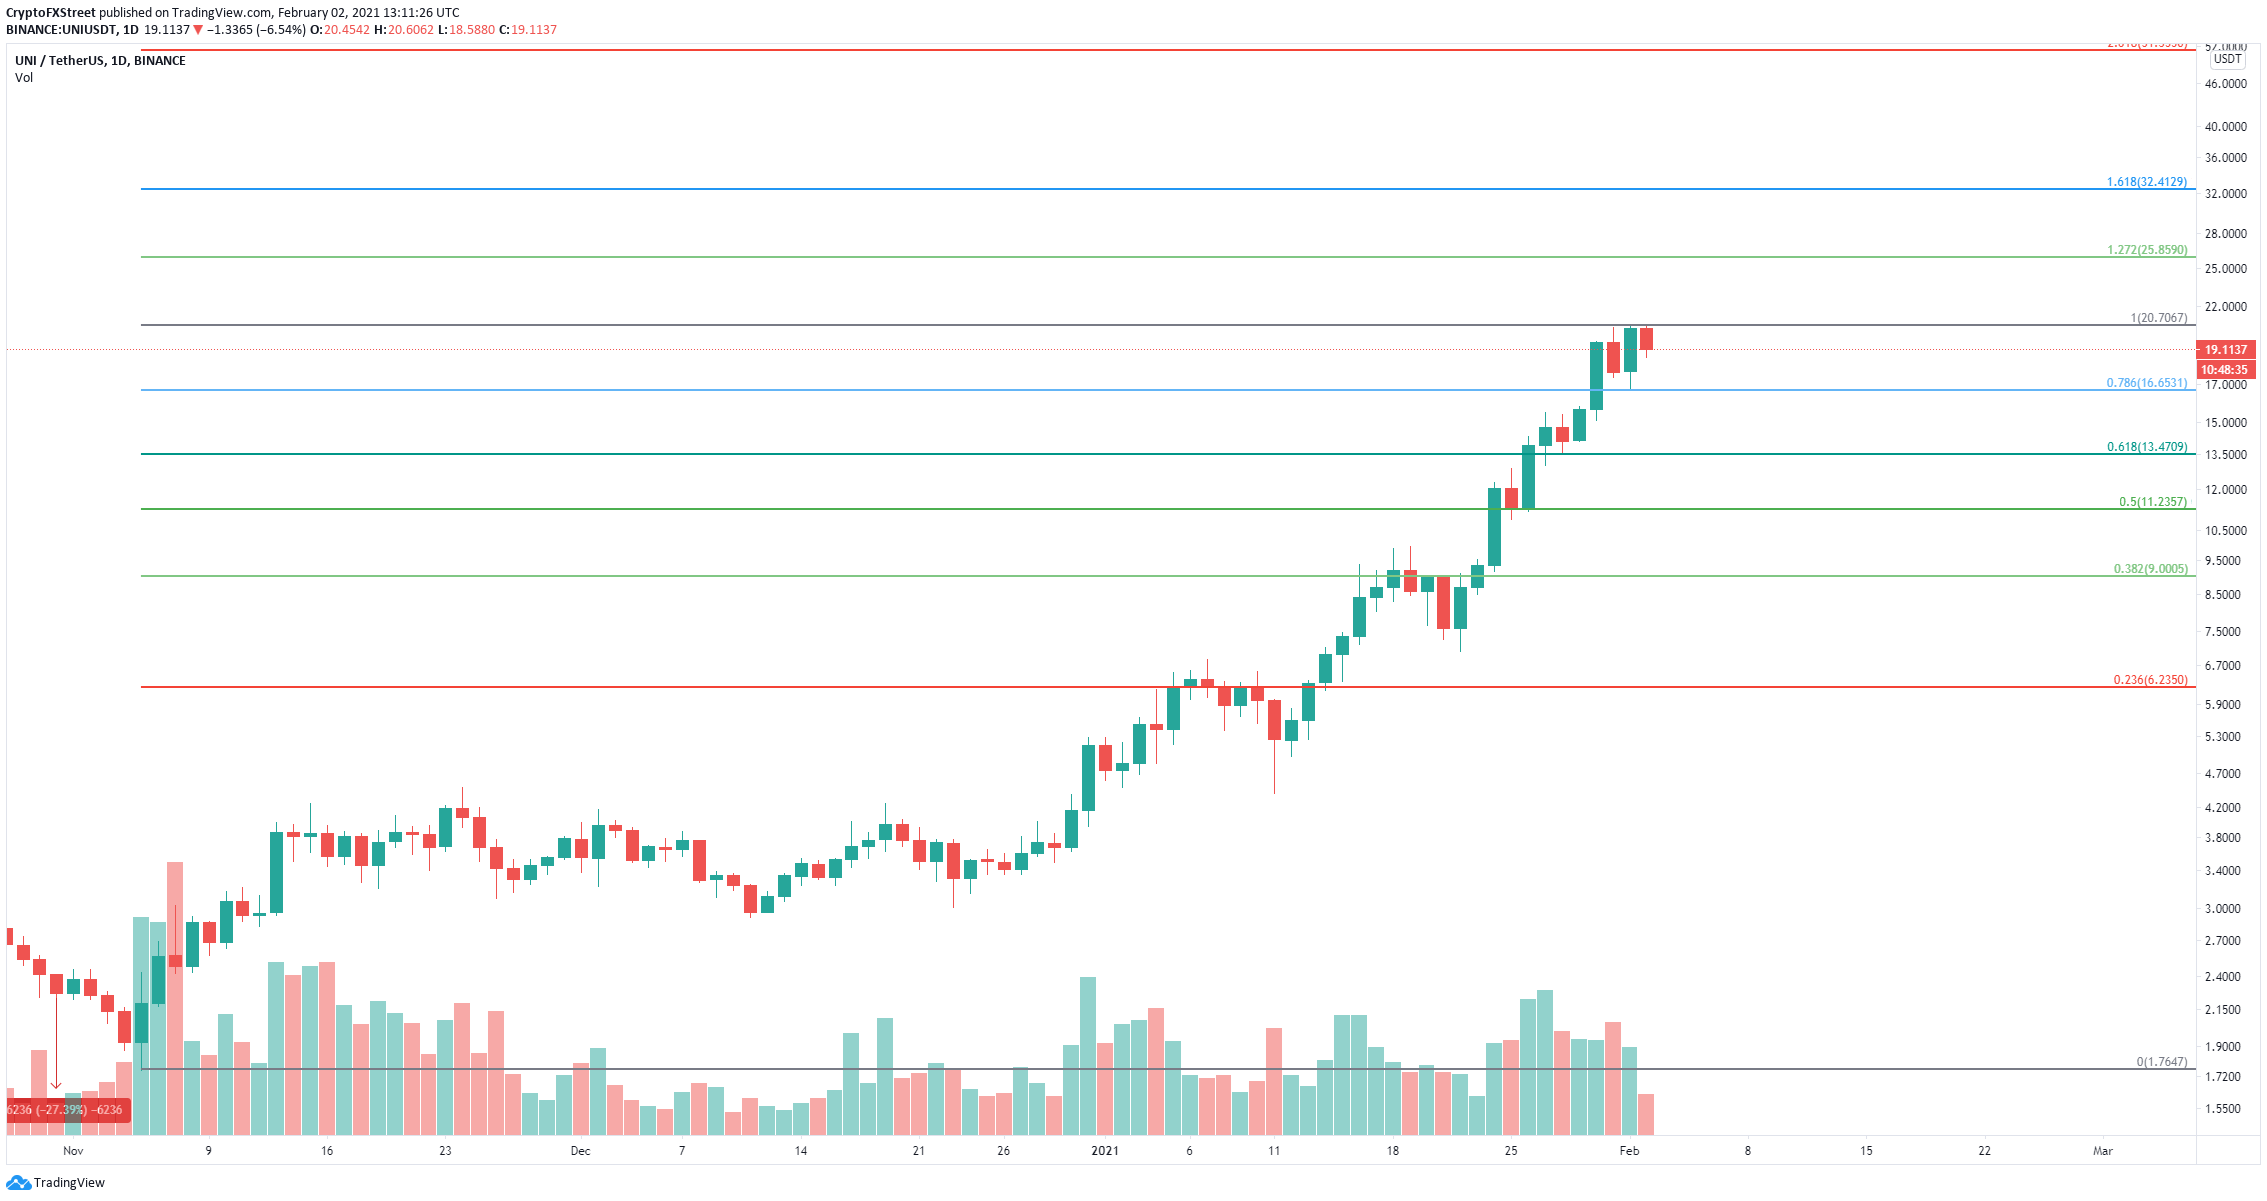
The Fibonacci Retracement indicator shows that Uniswap price will climb to $26 at the 127% level if there is a breakout above $20. The next price target would be $32.4 which is the 168% level.
Author

Lorenzo Stroe
Independent Analyst
Lorenzo is an experienced Technical Analyst and Content Writer who has been working in the cryptocurrency industry since 2012. He also has a passion for trading.



