Uniswap price soars to new all-time highs as UNI whales go into buying spree
- Uniswap’s ballistic uptrend is sustained by the rising buying pressure from the whales.
- Large volume holders, owning between 100,000 and 10 million UNI, rose by 18% in the last 30 days.
- UNI must break the immediate resistance and hold above $13 to avoid losses towards the 50 SMA.

Uniswap rallied to new all-time highs, surpassing $13. As discussed, the next target is at $15 and may soon be tested following the ongoing rebound after confirming support at $10.7. According to Santiment, an increase in whales adds force to the tailwind behind the crypto.
Uniswap sustains the uptrend after bouncing off support
At the time of writing, UNI/USD is trading at $12.6 after a minor but steady recovery from support recently formed at $10.7. The Moving Average Convergence Divergence (MACD) hints at a persistent uptrend. Until the MACD (blue line) crosses under the signal line, Uniswap will hold the uptrend in place.
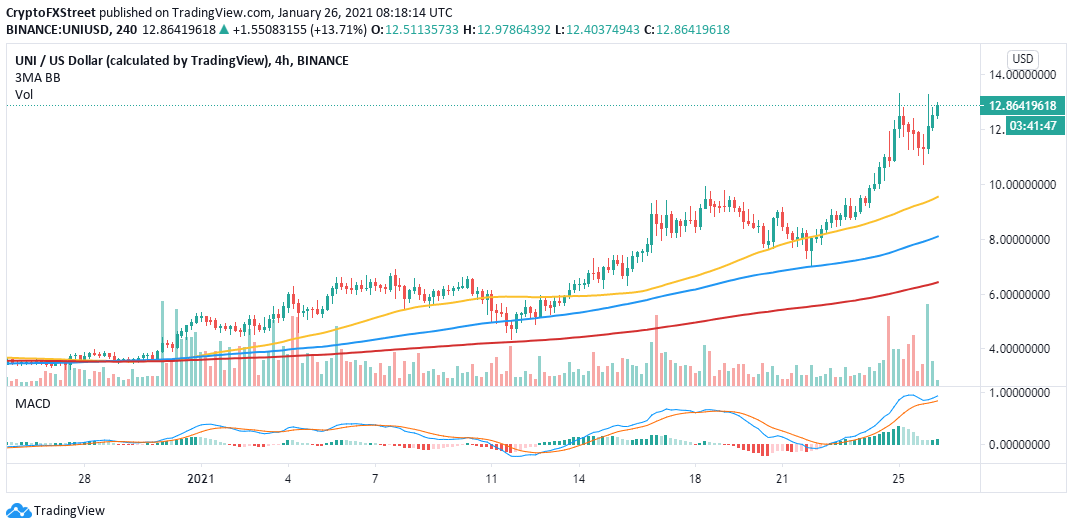
UNI/USD 4-hour chart
Uniswap whales massively fill their bags
Uniswap is yet to hit the local top as far as on-chain metrics are concerned. Santiment, a behavioral research platform, highlights an increase in the number of new whale addresses, holding between 100,000 and 10 million UNI.
The newly created addresses have increased from 131, recorded on December 31, to 160 at the time of writing, representing an 18% rise. This is a significant surge and implies that buying pressure is ballooning. Therefore, if the trend remains intact, Uniswap may carry on with the rally, first stepping above $15 and then shifting the focus to $20.
%20[11.17.53,%2026%20Jan,%202021]-637472470944681353.png)
Uniswap holder distribution
Looking at the other side of the picture
It is worth noting that if Uniswap fails to subdue the resistance at $13, a breakdown may come into the picture. Support is anticipated at $10.7, but if broken, Uniswap could freefall to test the 50 Simple Moving Average on the 4-hour chart or the 100 SMA, slightly above $8.
Author

John Isige
FXStreet
John Isige is a seasoned cryptocurrency journalist and markets analyst committed to delivering high-quality, actionable insights tailored to traders, investors, and crypto enthusiasts. He enjoys deep dives into emerging Web3 tren



