UniSwap Price Forecast: UNI falling in tandem with DEXs' volume aiming for $2.5
- UniSwap's exchange volume tanks by 62% from September's peak of $16.4 billion.
- UNI/USD uptrend remains unsupported, calling for a reversal in the near term.

UniSwap lock-step trading over the last two weeks has generally sustained a negative gradient. Before the retracement commenced, the decentralized exchange token recovered by more than 45% from the dip to $2.5 to levels slightly above $3.5.
UniSwap's initial governance vote flops massively
UniSwap is an on-chain governance token that allows the community to decide on the decentralized platform's critical matters. However, the first governance vote held recently did not achieve the set threshold.
Intriguingly, 98% of all the votes cast supported the change that had been proposed. Unfortunately, the votes cast failed to meet the 40 million threshold needed by approximately 400,000.
At the final tally, votes cast in support of the proposal to bring down the token threshold needed to pass proposals on the platform stood at roughly 39.5 million against a mere 697,000. If the vote has sailed through, the required would have slashed by a third and the voted needed will reduce to 30 million.
UniSwap fails to build momentum
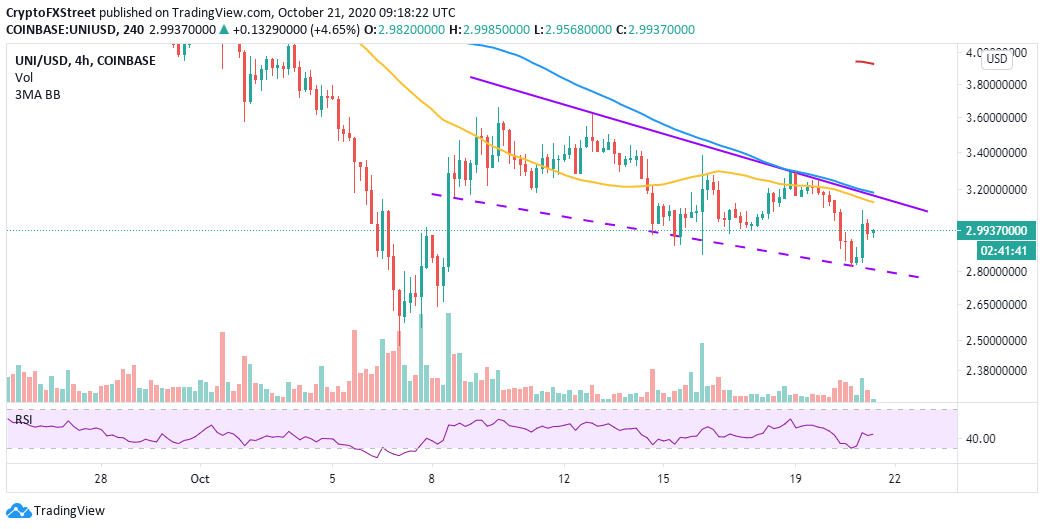
Following a recent bounce from the short term support at $2.8, UNI/USD lost steam within a whisker of the 50 Simple Moving Average (SMA) in the 4-hour timeframe. Also adding weight to the rejection were the 100 SMA and the descending trendline.
UNI is pivotal at $3 amid struggle in the bullish camp to refocus the asset back into the upward trajectory. However, the above hurdles are unlikely to give UNI smooth sailing. Therefore, a breakdown is likely to fall before a significant recovery comes into the picture.
UNI/USD 4-hour chart
IntoTheBlock IOMAP model shows the absence of strong support zones except for demand between $2.86 and $2.9. Here, roughly 1,400 addresses previously bought approximately 6.4 million UNI.
On the upside, the strong resistance zones ahead of UNI add credence to the bearish outlook. The model highlights $3.2 and $3.3 as the most substantial hurdle. Previously, about 2,600 addresses purchased 39.3 million UNI.
UniSwap IOMAP chart
-637388713687926049.png)
UniSwap exchange corrects by 62% from the peak
November is around the corner, and so is the end of the year. Decentralized exchanges (DEXs) like UniSwap have been gaining momentum, especially with centralized exchanges like OKEx being in hot soup over users' funds' safety.
UniSwap's volume surged to $15.4 billion in September (highest since its inception). At the time of writing, the volume has dropped to $6.2 billion, representing a 62% decline. The decrease has been observed across all DEXs according to data by The Block.
It remains uncertain whether DEXs will make an upturn in terms of volume, considering we have only 11 days before the end of October. However, any significant rise in the exchange volume is likely to pull tokens like UNI upwards.
Looking at the other side of the fence
It is worth mentioning that UNI's bearish outlook will be invalidated if the resistances at the 50 SMA, the 100 SMA and the descending trendline are pushed into the rearview. Besides, if the pattern on the 4-hour confirms a falling wedge, a reversal will come into the picture, elevating the crypto asset to $3.6.
Author

John Isige
FXStreet
John Isige is a seasoned cryptocurrency journalist and markets analyst committed to delivering high-quality, actionable insights tailored to traders, investors, and crypto enthusiasts. He enjoys deep dives into emerging Web3 tren



