Tron Price Prediction: TRX prepares for short-term rebound
- Tron price is moving closer to a bullish breakout with the appearance of a falling wedge.
- A 3% bullish move is expected from Tron's breakout point.
- Support at $0.0620 must be defended at all costs to prevent declines from stretching to $0.0610.

Tron price is trying to find its footing after retracing from resistance encountered at $0.0650. The DAO (decentralized autonomous organization) token had on October 24 rebounded from support established between $0.0602 and $0.0610, in tandem with last week's crypto market relief rally.
Tron's newly created accounts hit 4.4 million in October
Tron has on Wednesday released the network's monthly report, depicting positive growth for its TRX token. Newly created accounts surpassed the 4.4 million mark, while the platform's TVL (Total Value Locked) climbed to $12.65 million – the highest in Tron's DeFi (decentralized finance) history.
Other key developments include the listing on the Binance-CoinMarketCap cryptocurrency's top ten Equal-Weighted Index and the launch of TRX staking on Binance US. The Tron network achieved a lot in October, which could boost TRX price in November. All eyes are fixated on the token's ability to defend the support at $0.0620 ahead of the expected bullish breakout.
Tron price is about to flip bullish
Tron price appears to be at the tail end of its retracement from $0.0650. Looking at the eight-hour chart, a falling wedge could confirm a 3.01% move to the upside. This pattern forms when the price consolidates between two downward-sloping, tapering resistance and support lines. The pattern points to a possible trend reversal (in case of a length downtrend) or trend continuation (in case of an uptrend).
A significant bullish move is expected after Tron price breaks above the upper trend line. The falling wedge has a precise profit target (3.01%) equal to the distance between its widest points and extrapolated above the Tron price breakout point.
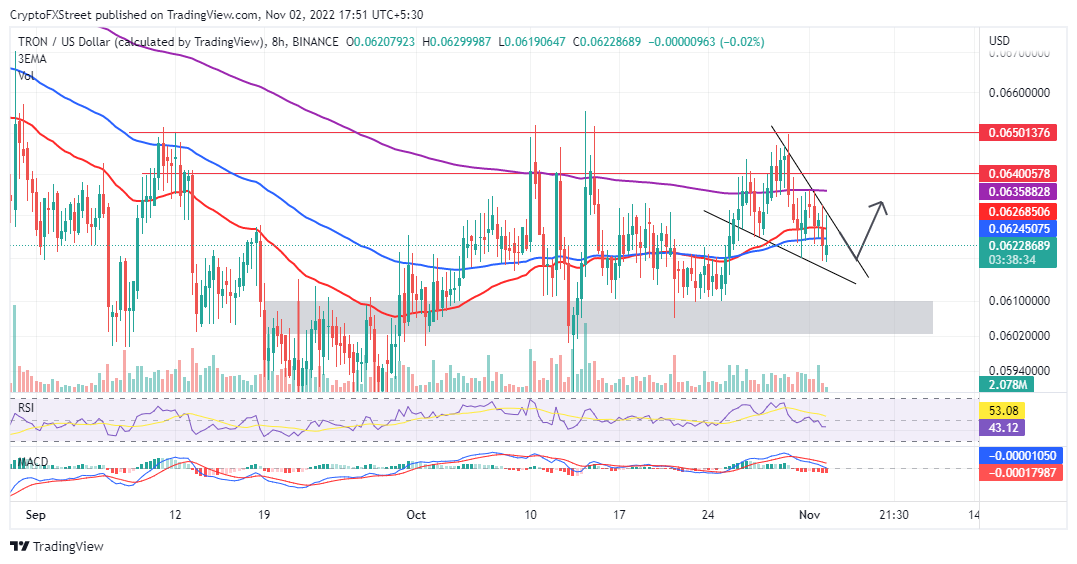
TRX/USD daily chart
Traders must tread carefully, keeping in mind that the MACD (Moving Average Convergence Divergence) dons a sell signal. As analyzed above, failure to break above the wedge pattern could put pressure on support at $0.0620, paving a southbound move to $0.0610 and $0.0620 – if push comes to shove.
Author

John Isige
FXStreet
John Isige is a seasoned cryptocurrency journalist and markets analyst committed to delivering high-quality, actionable insights tailored to traders, investors, and crypto enthusiasts. He enjoys deep dives into emerging Web3 tren



