TRON Price Prediction: TRX on verge of new yearly highs above $0.15
- TRON price is trading inside an ascending wedge pattern on the 4-hour chart.
- The digital asset faces only one crucial resistance level before a breakout to new yearly highs.
- A key indicator has presented a sell signal, which puts the bullish outlook at risk.

TRON has managed to establish a strong 4-hour uptrend since April 7 and faces practically no resistance ahead. However, the TD Sequential indicator has presented a sell signal in the past 12 hours that could shift the odds in favor of the bulls.
TRON price needs to crack only one resistance level for a 16% breakout
On the 4-hour chart, TRX has formed an ascending wedge pattern that can be drawn by connecting the higher highs and higher lows with two trend lines that converge.
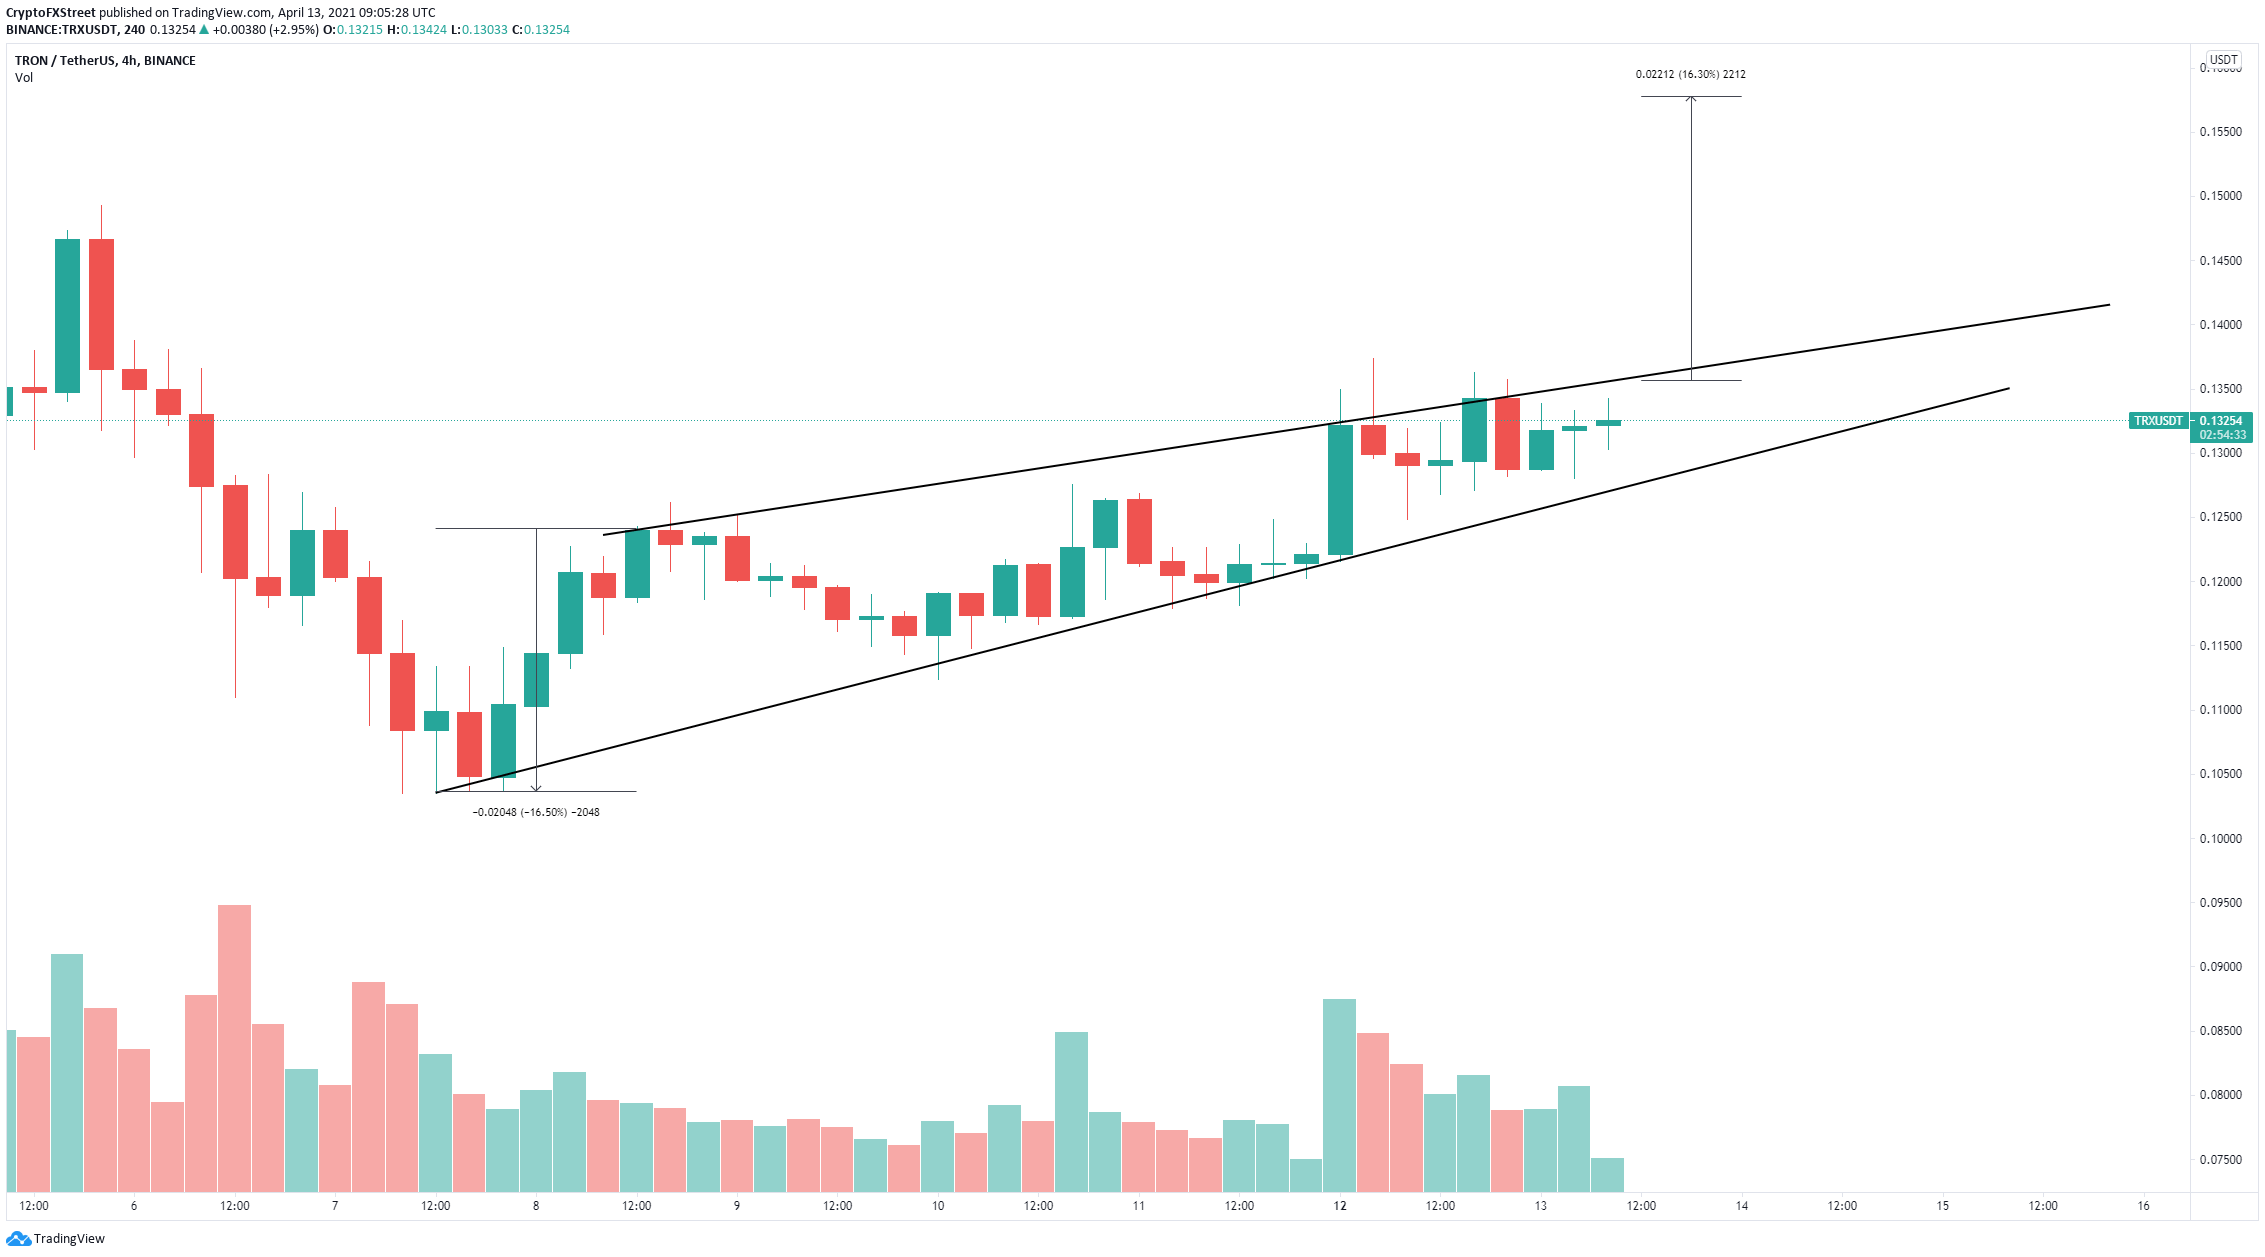
TRX/USD 4-hour chart
The digital asset needs to climb above $0.136 for a significant 16% breakout calculated by measuring the height between the beginning of the top trend line and the bottom one. Although the price target is $0.16, TRON could briefly stop at $0.149, the 2021-high.
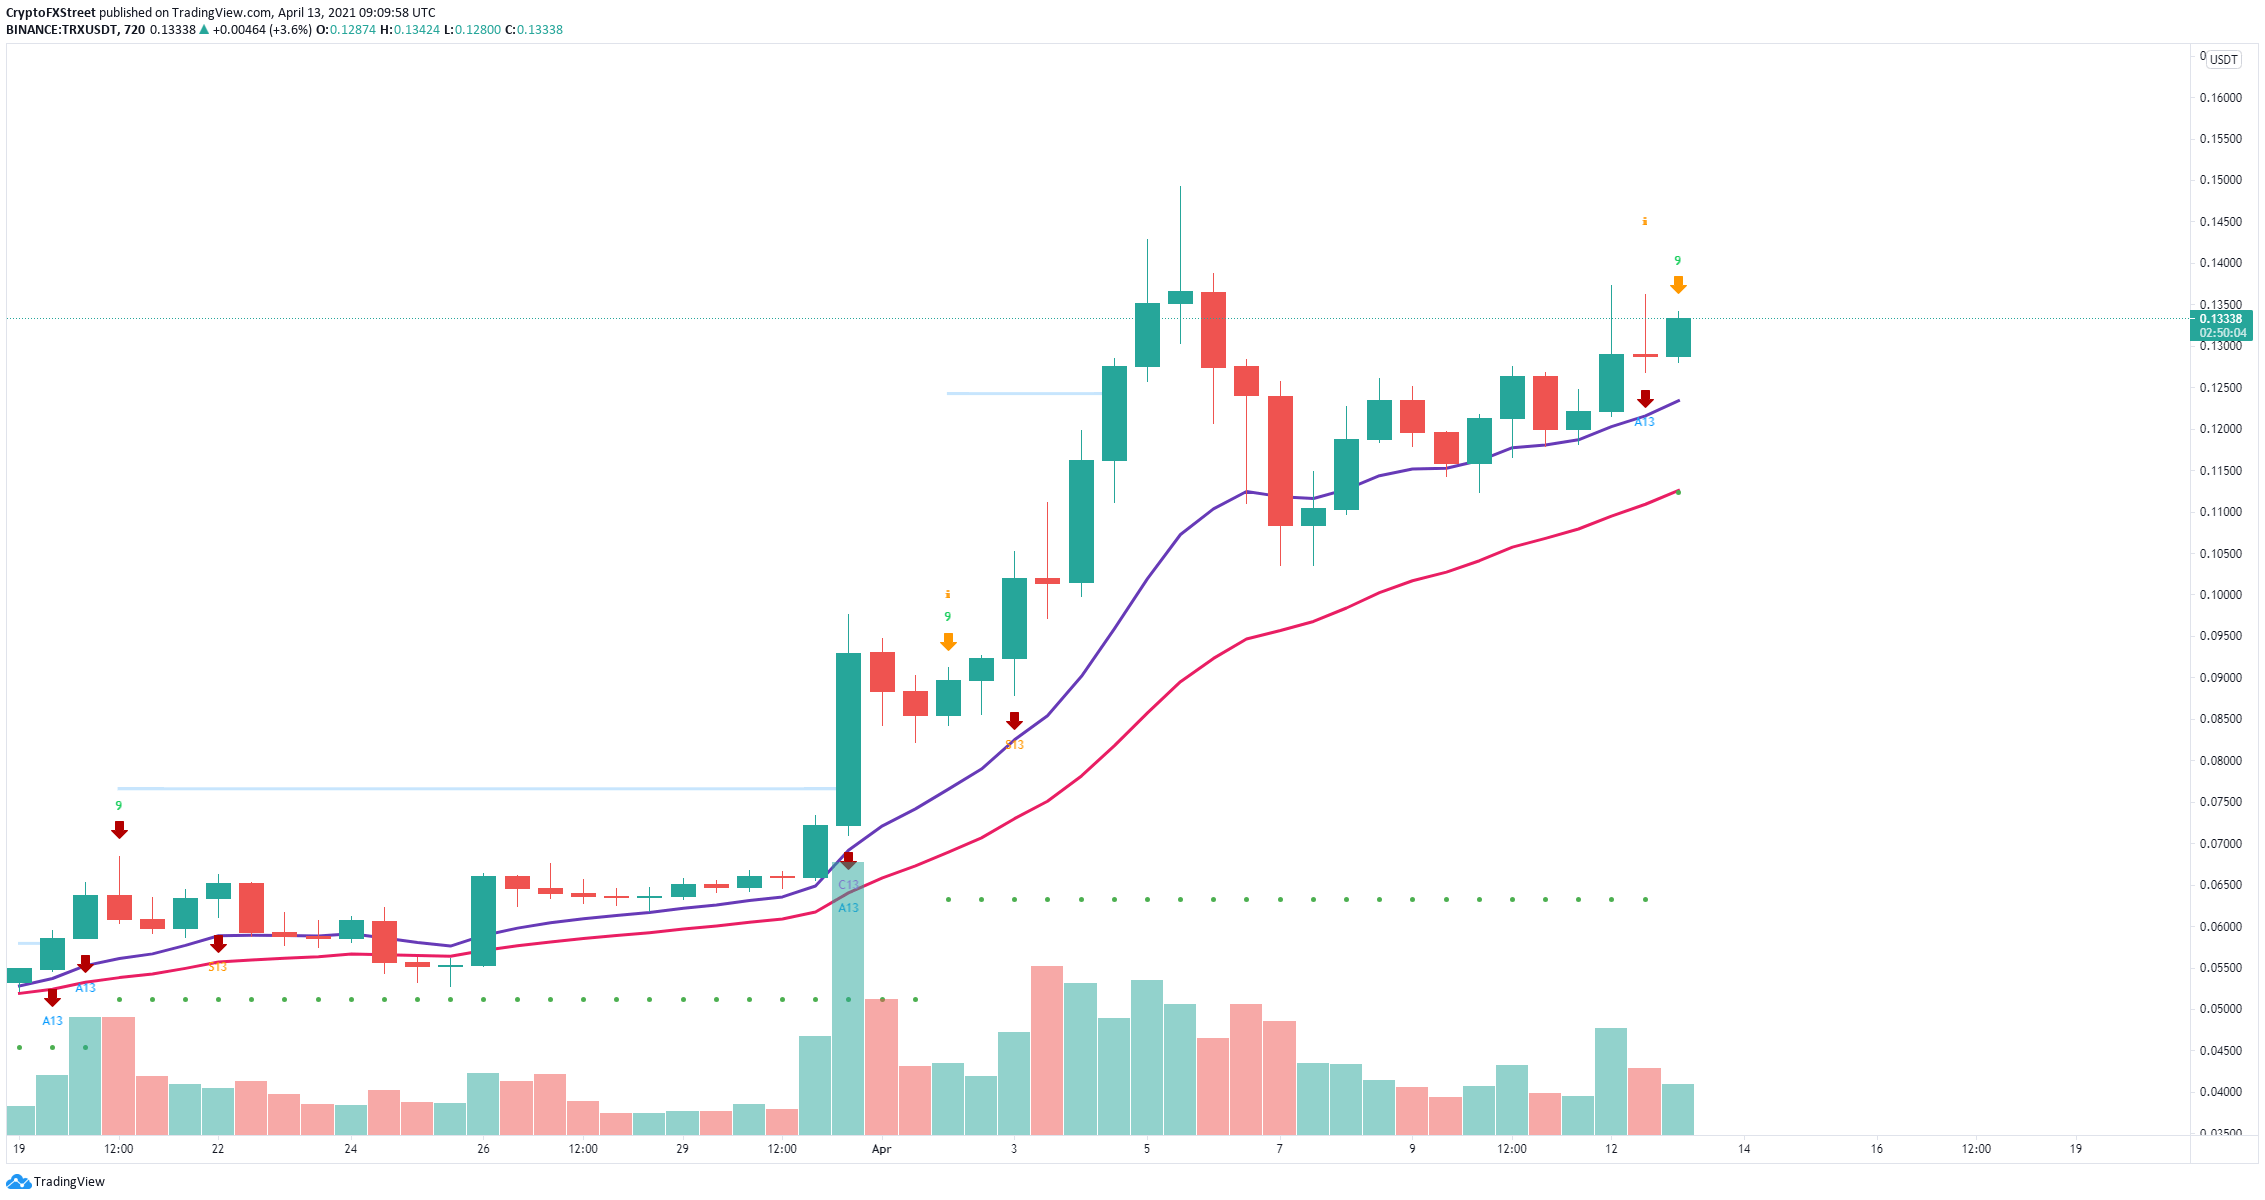
TRX/USD 12-hour chart
However, on the 12-hour chart, the TD Sequential indicator has just presented a sell signal in the form of a green ‘9’ candlestick. If the bulls cannot push TRX above $0.136, the signal will be confirmed.
The nearest bearish price target for TRON is the 12 EMA at $0.123 followed by the 26 EMA at $0.112.
Author

Lorenzo Stroe
Independent Analyst
Lorenzo is an experienced Technical Analyst and Content Writer who has been working in the cryptocurrency industry since 2012. He also has a passion for trading.


