- Tron price lost 20% of market value since the start of November.
- TRX price shows bears in control of the larger trend on the Relative Stregnth Index, hinting that the recent swing low is not a stable bottom.
- Invalidation of the bearish thesis is a breach above $0.054.
Tron price (TRX)) has witnessed a severe decline throughout November. As a consolidation ensues, the technicals suggest one more low is on the cards that could wipe out early bulls. Key levels have been defined to gauge Tron’s next potential move.
Tron price in a bearish stronghold
TRX price has declined by 20% since the start of November. During the downswings, the bulls have struggled to retaliate for more than a day or so before the bears initiate another attack. On November 23, the TRX price consolidates above the 8-day exponential moving average, likely enticing early bulls to enter the market. Still, the smart-contract token may hint at one more price drop in the upcoming days.
Tron price currently auctions at $0.05. The Volume Profile Indicator has produced fewer transactions than the June 13 low. The indicator is an additional reason to believe the downtrend could be coming to an end. However, traders should pay close attention to the Relative Strength Index (RSI) as the newfound lows also printed a lower low on the indicator when compared to the lows on January 22. Bulls convinced that the recent monthly lows at $0.045 will hold may be in for a rude awakening sooner than later.
Based on the RSI reading, This thesis proposes that the low established On Monday, November 14, is unstable and will eventually serve as excellent liquidity for smart money bears to aim for. The liquidity zones at $0.040 and potentially $0.034 would be the next bearish target levels.
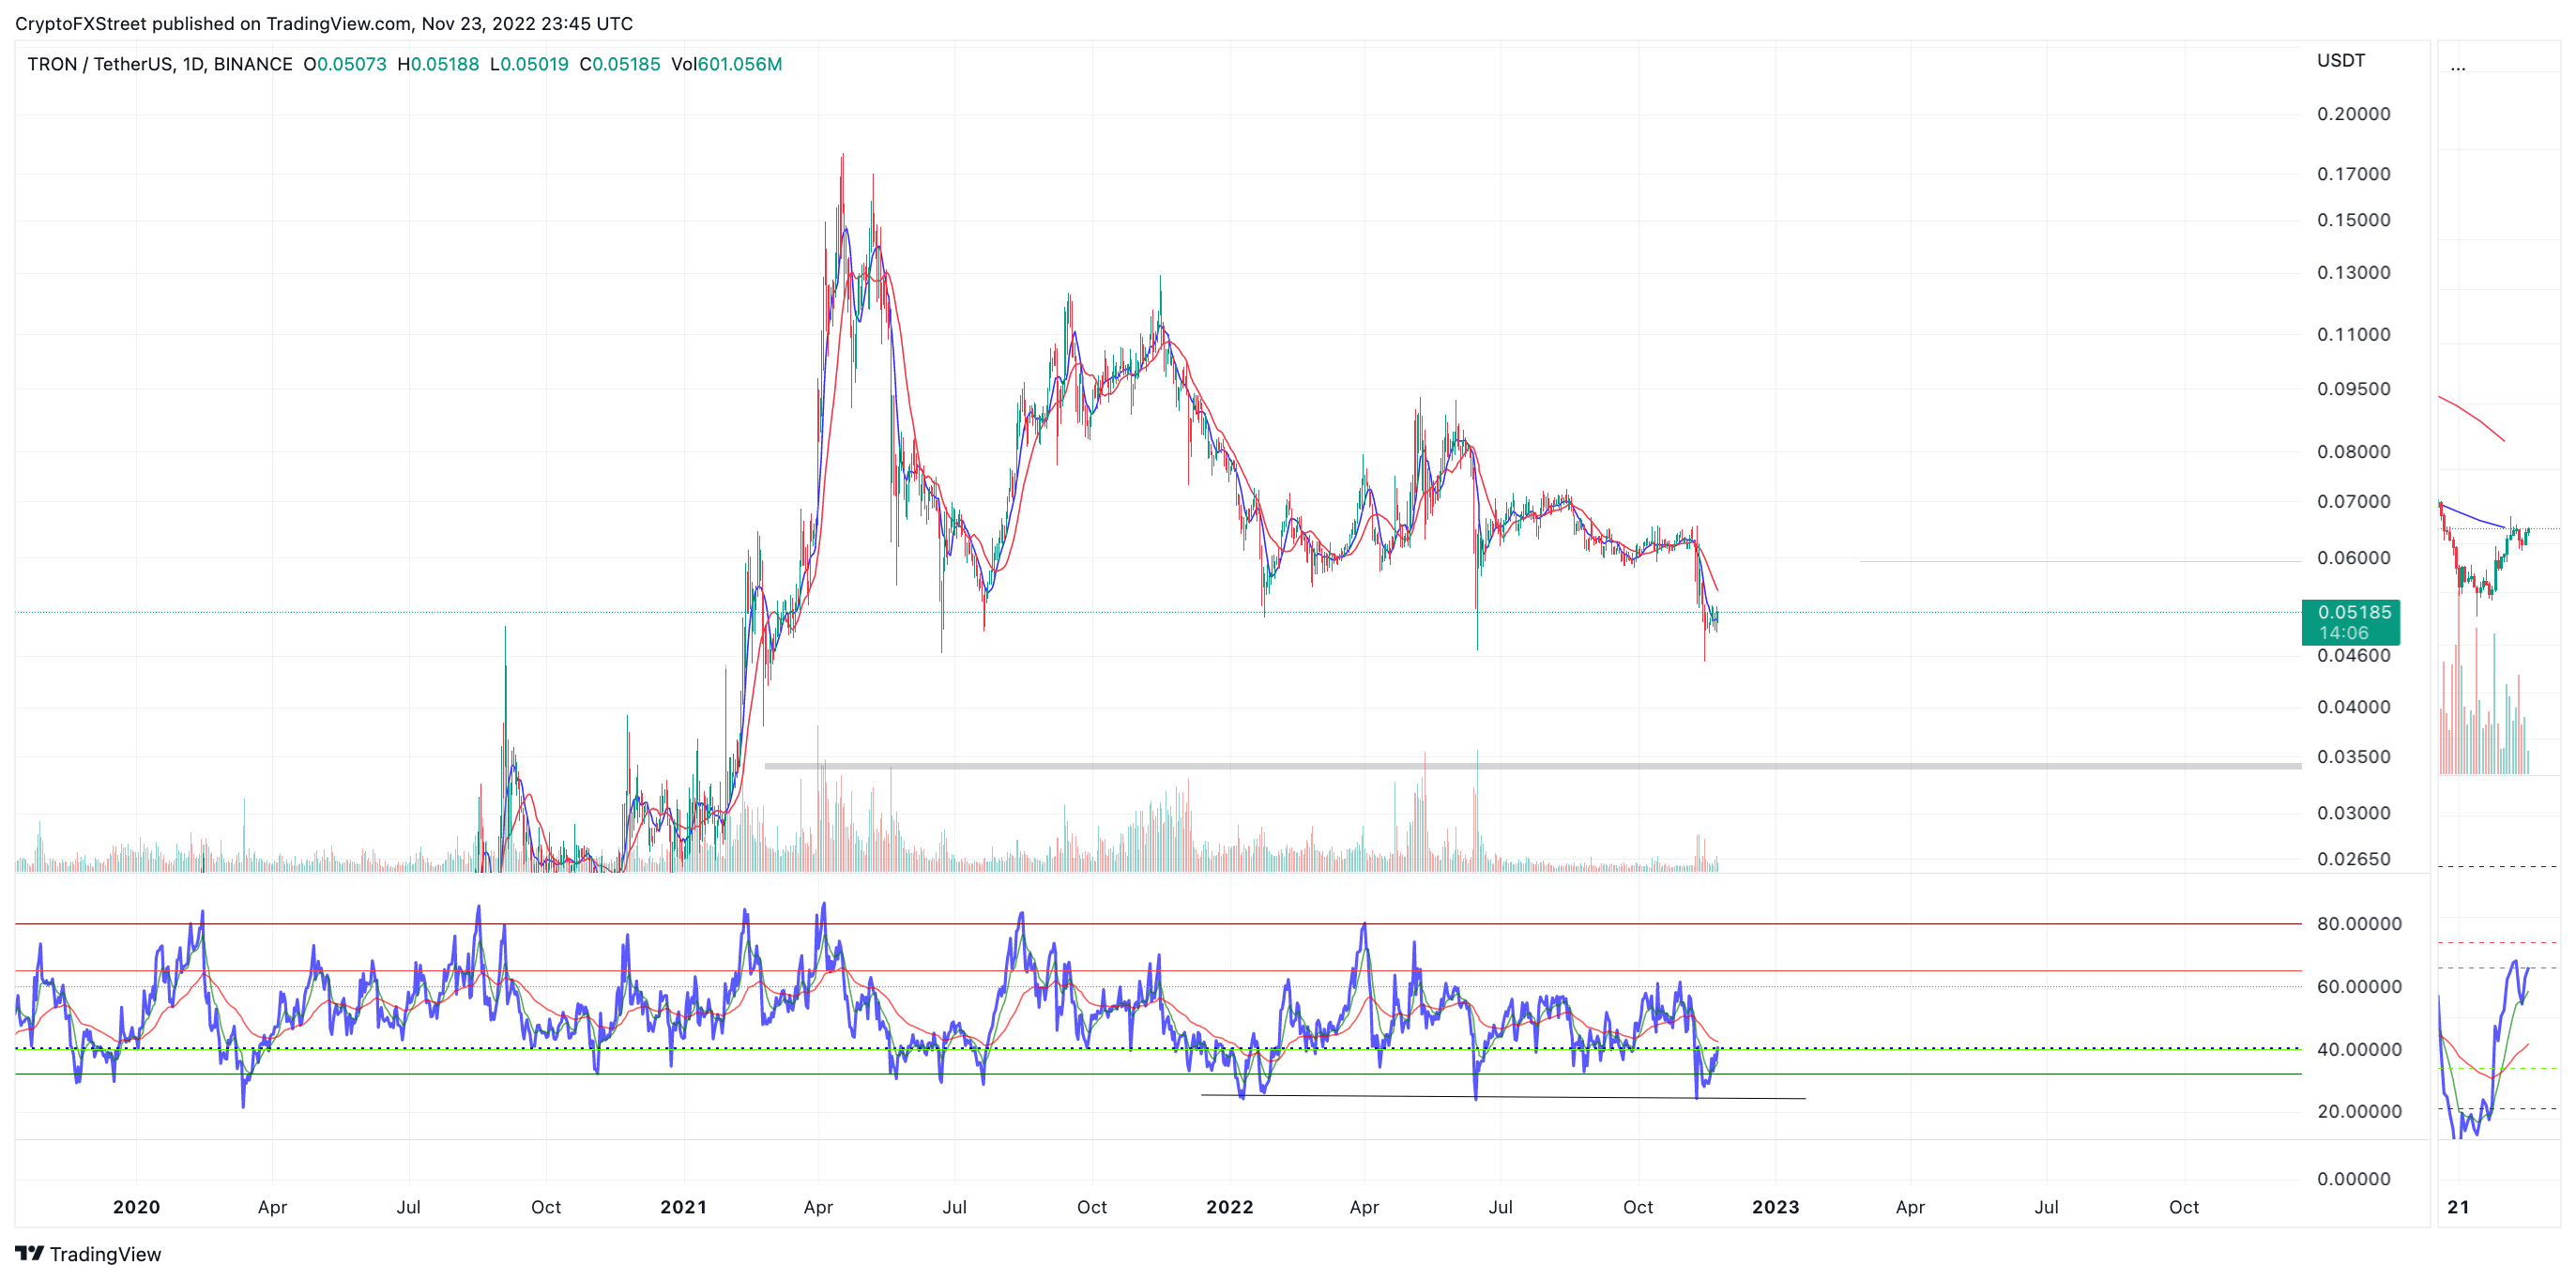
TRX/USDT 1-day chart
Invalidation of the bearish idea could occur if the bulls manage to hurdle the 21-day simple moving average at $0.054. In doing so, an additional uptrend hike towards $0.065 would likely occur. Such a move would result in a 23% increase from the current TRX price.
In the following video, our analysts deep dive into the price action of Bitcoin, analyzing key levels of interest in the market. -FXStreet Team
Information on these pages contains forward-looking statements that involve risks and uncertainties. Markets and instruments profiled on this page are for informational purposes only and should not in any way come across as a recommendation to buy or sell in these assets. You should do your own thorough research before making any investment decisions. FXStreet does not in any way guarantee that this information is free from mistakes, errors, or material misstatements. It also does not guarantee that this information is of a timely nature. Investing in Open Markets involves a great deal of risk, including the loss of all or a portion of your investment, as well as emotional distress. All risks, losses and costs associated with investing, including total loss of principal, are your responsibility. The views and opinions expressed in this article are those of the authors and do not necessarily reflect the official policy or position of FXStreet nor its advertisers. The author will not be held responsible for information that is found at the end of links posted on this page.
If not otherwise explicitly mentioned in the body of the article, at the time of writing, the author has no position in any stock mentioned in this article and no business relationship with any company mentioned. The author has not received compensation for writing this article, other than from FXStreet.
FXStreet and the author do not provide personalized recommendations. The author makes no representations as to the accuracy, completeness, or suitability of this information. FXStreet and the author will not be liable for any errors, omissions or any losses, injuries or damages arising from this information and its display or use. Errors and omissions excepted.
The author and FXStreet are not registered investment advisors and nothing in this article is intended to be investment advice.
Recommended Content
Editors’ Picks
Shiba Inu price stagnancy brings investors’ losses to a 28-month high

Shiba Inu has been rather dormant these past four weeks, which is bearing a negative impact on the investors. The meme coin market has been struggling to make headlines as the lack of increase in altcoin’s market value has left investors in peril, which is now driving them to pull back and wait until SHIB starts rising again.
LDO sees lowest cumulative volume in ten months as Lido DAO price struggles to breach key barrier

Lido DAO price is up over the past day as the market shifted its stance despite the SEC announcing a delay in the spot Bitcoin ETF applications of BlackRock among other applicants. However, this one-day rise is not enough for the likes of LDO that have been failing in recovering for a few weeks now.
THORChain leaps 12% with soaring open interest as RUNE targets a peak of its current range

THORChain is testing a crucial multi-month obstacle after a remarkable climb. The move has completed the altcoin’s recovery rally following the 15% fall of September 27. RUNE has outperformed the broader market, with Bitcoin and Ethereum recording only up to 3% in daily gains.
Chainlink and Australia’s ANZ Bank issue AUD-stablecoin to successfully test interoperability

Chainlink put itself on the map with the help of its real-time data-feeding Oracles and is now in the spotlight for its interoperability protocol. Through this protocol, the blockchain project intends to not only connect two or five chains but also create the world’s largest liquidity layer, starting with Australia’s second-largest bank.
Bitcoin: BTC recovery rally could be bull trap in disguise, here’s why

Bitcoin (BTC) price remains unfazed even after the multiple spot BTC ETF delays from the US Securities & Exchange Commission (SEC). But investors need to be careful with the ongoing BTC rally as it could be a trap for early bulls.